January 7, 2016
Dear Data Two | Week 39: Beauty
beauty
,
circles
,
color
,
Dear Data Two
,
lines
,
marks
,
shapes
2 comments

This week really helped me appreciate the exceptional beauty that is around me every day, whether it be our wonderful parks, the people I see, or the amazing architecture London offers. I had this week off from work, so I was able to spend a lot of time with my family going on walks, visiting museums, playing games, etc. So the topic, combined with the time I spent with my family, really made for a wonderfully positive week after a rather crappy Christmas week.
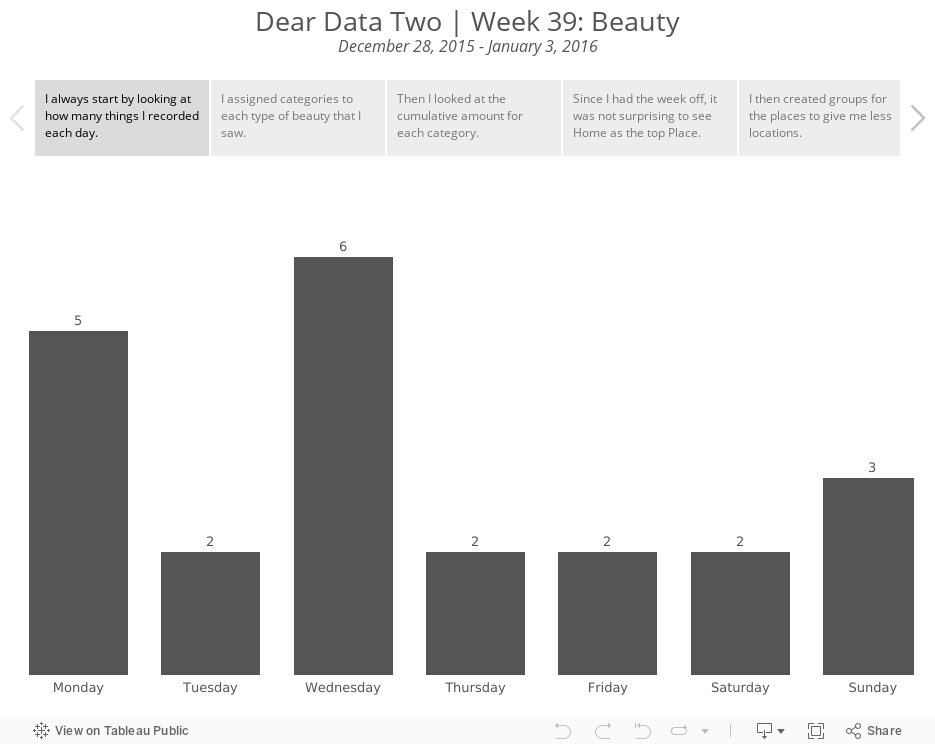
My analysis of the data started much like every other week: exploring what each dimension I tracked offered, looking for stories, trying to find patterns. I didn't learn a whole lot about myself, but trying to emulate what Giorgia did in her postcard for this week helped me continue to learn about using Tableau as a drawing canvas.
The trouble I run into time and time again is that I have so many dimensions that I want to put in a single view, but if I add them all in Tableau, the view quickly becomes impossible to comprehend. However, I'm really beginning to appreciate the freedom that drawing on a postcard gives me. I can incorporate as many dimensions as I'd like through the use of symbols and marks in a way that doesn't clutter the visualisation and aids in understanding.
I'm not sure why, but I feel like I'm starting to grow as a data artist, particularly when it comes to pen and paper. My ideas are flowing at the moment. Let's hope I can continue the momentum for the remaining 13 weeks.
Explore my week below by click through the story points. Enjoy!
Subscribe to:
Post Comments
(
Atom
)


Hi Andy,
ReplyDeleteThis one is inspiring to me. I'm embarking on my first month of the Data Chain, and my first time ever doing any kind of quantified self data collection/analysis, and I really like how you've visualized the data this week given the number of variables you had to work with. This has definitely given me some ideas for how I might want to visualize the data I'm collecting. I won't know for sure until this week's data collection is complete and I go about exploring it in Tableau, but what you've done here really resonates with me.
-Mike
Thanks Michael! I'm glad you like it. I get so much inspiration from Giorgia and Stefanie so happy to hear I'm passing that along.
Delete