September 27, 2017
Roads Across America - Tableau 10.4 Linear Geometries
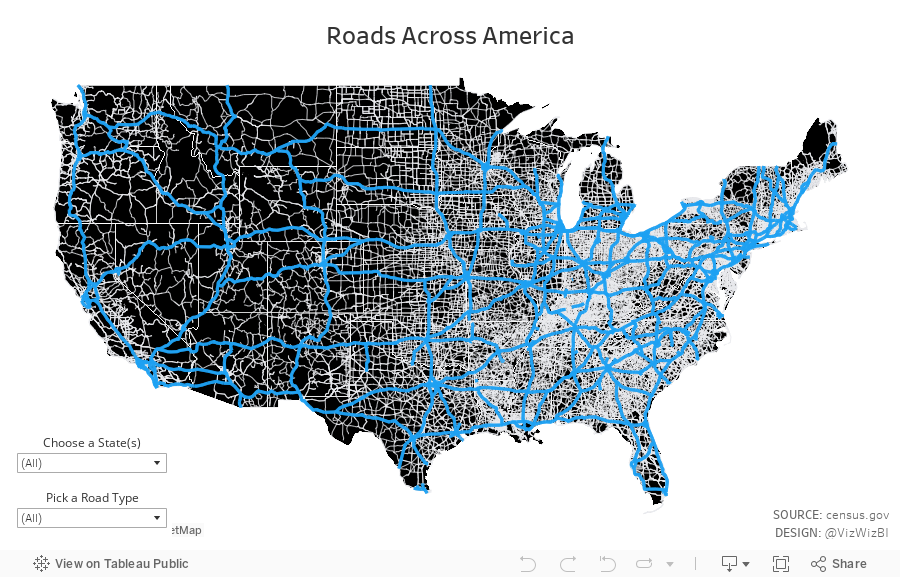
Tableau 10.4 came out this week and with it support for linear geometry shapefiles. This feature makes visualizing routing data so much easier and faster. You no longer have to plot each point, change the mark type to line and play a game of connect the dots. Now, connect directly to your shapefiles and you're done!Of course, I had to play with it. I went to the US Census website and downloaded shapefiles for every primary and secondary road for each State. With a couple clicks, I had an incredible map showing all of these roads. I wanted to highlight interstates, so I made them blue. 62,000 roads plotted with only a couple of clicks. Amazing!
Have a play with it yourself below! I'm excited about what boxes are now opened with this new capability.
Subscribe to:
Post Comments
(
Atom
)


Andy,
ReplyDeleteGreat map! I downloaded the zip file from the census site. After loading the shp file into the Tableau, there is no State column. Did you run some union operations on the data and label each state?
Hi Alex. The State name is in the name of the file. If you include the file name in the union of all of the state files, you’re all set. I believe I wrote a formula to parse out the state.
Delete