April 8, 2019
#MakeoverMonday: Cash Solvency of US States

States face many fiscal problems, but these problems are not insurmountable. Studying how each state is performing with regard to a variety of fiscal indicators can help state policymakers address persistent issues and anticipate potential problems.
Mercatus produces this simple map to visualize the results:

What works well?
- By using a map, people instantly know this is about geographical information.
- Using a clear legend with distinct colors to indicate good vs. bad
- Including the top 5 and bottom 5 as a summary/key finding
- Overall, a very nice layout with the map on the left and the additional context on the right.
- Including the numbers on the States for context.
What could be improved?
- Do the colors work for the color-blind? I'd recommend running it through a color blind checker.
- The States need equal size weighting to ensure they can all be visible equally. This would also help with some of the labels needing to be lines that point to the respective States.
- There's no definition for fiscal ranking.
What I did
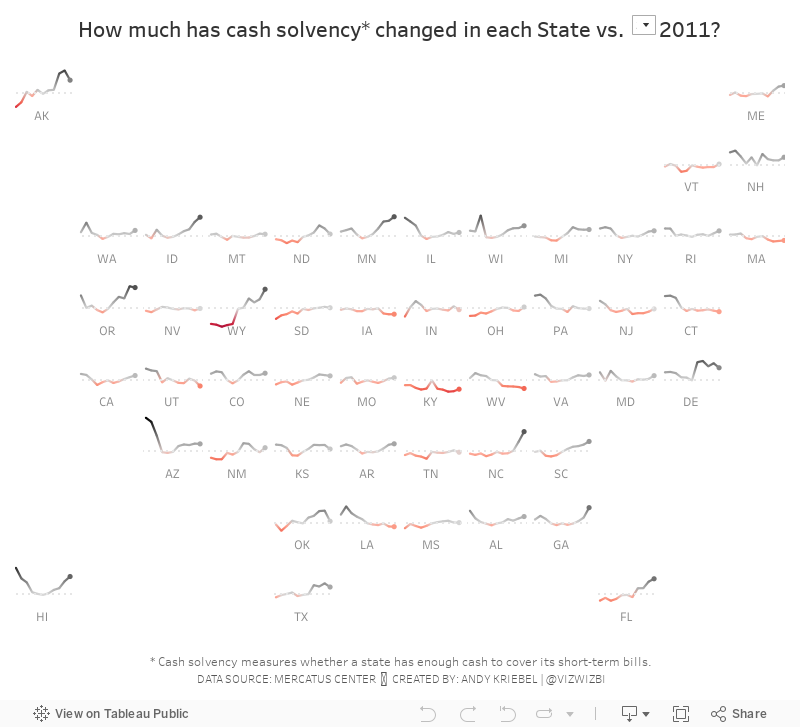
- I wanted to look at the data over time, but also look at all of the States at the same time. For this I used a tile map. I based it on a similar viz I created.
- I wanted to give the user an option to compare years to a year they select so that they can see the change compared to a point in time.
- Use color to indicate the positive or negative change vs. the year selected.
- I created the calculations for each of the rankings and found cash solvency to be the most interesting, so I focused on that.
And here's my viz for Makeover Monday week 15.
Subscribe to:
Post Comments
(
Atom
)


No comments
Post a Comment