December 20, 2021
How to Filter by Rank Across Multiple Worksheets
boolean
,
bottom
,
calculated field
,
dashboard
,
filter
,
parameter
,
rank
,
table calc
,
table calc filter
,
table calculation
,
tableau
,
tip
,
top
,
worksheets
No comments
In this tip, I show you how to use a parameter to filter the rank across multiple worksheets or an entire dashboard.
December 8, 2021
#WOW2021 Week 45: Customer Purchasing Habits (RFM Analysis)
bar chart
,
color
,
customer purchasing habits
,
dashboard
,
dot plot
,
dual axis
,
how to
,
labels
,
mark type
,
parameter
,
RFM analysis
,
threshold
,
Workout Wednesday
,
WOW2021
No comments

Personally, I felt a lot of pressure not to mess up with Ann watching. As Erica Hughes of DS20 pointed out, this is how I make them feel during training. I promise it's done with love! 🙂
Here's the video of our session. We nearly finished in the allocated hour. After we dropped off, I cleaned up the tooltips and put together the dashboard, so that's not included in the video.
Click on the image below to view the viz on Tableau Public.
December 7, 2021
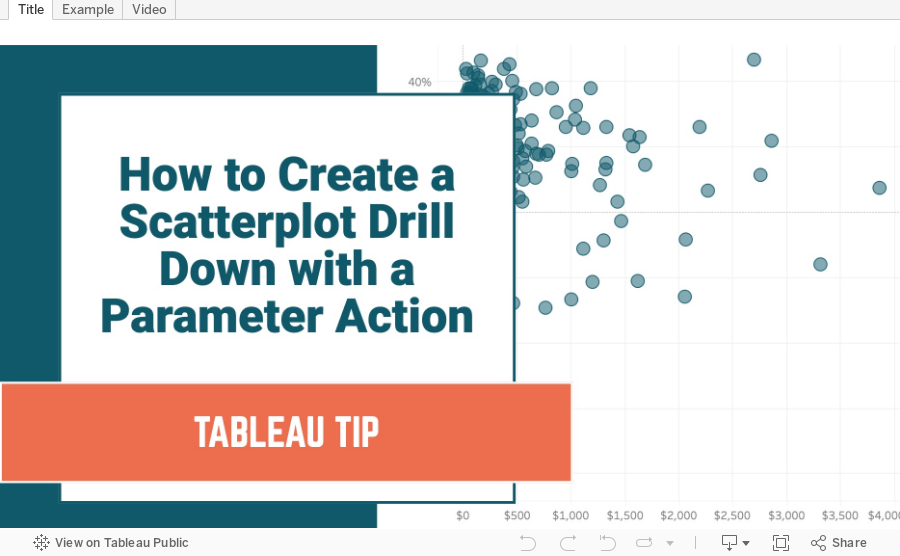
How to Create a Scatterplot Drill Down with a Parameter Action
analysis
,
calculated field
,
chart
,
dashboard action
,
drill down
,
drilldown
,
filter
,
graph
,
how to
,
IIF
,
parameter
,
parameter action
,
scatter plot
,
scatterplot
,
tableau
,
tip
,
tutorial
,
worksheet action
No comments
In this example, I show you how to create an interactive scatterplot that allows the user to select a mark in a scatterplot to drill down to the underlying data. This tutorial shows you how to drill down from Sub-Category to Product. This process will work for any two dimensions.
Subscribe to:
Posts
(
Atom
)


