October 3, 2023
Master Dynamic Zone Visibility in Tableau: Yearly to Monthly Calendar Drill Down

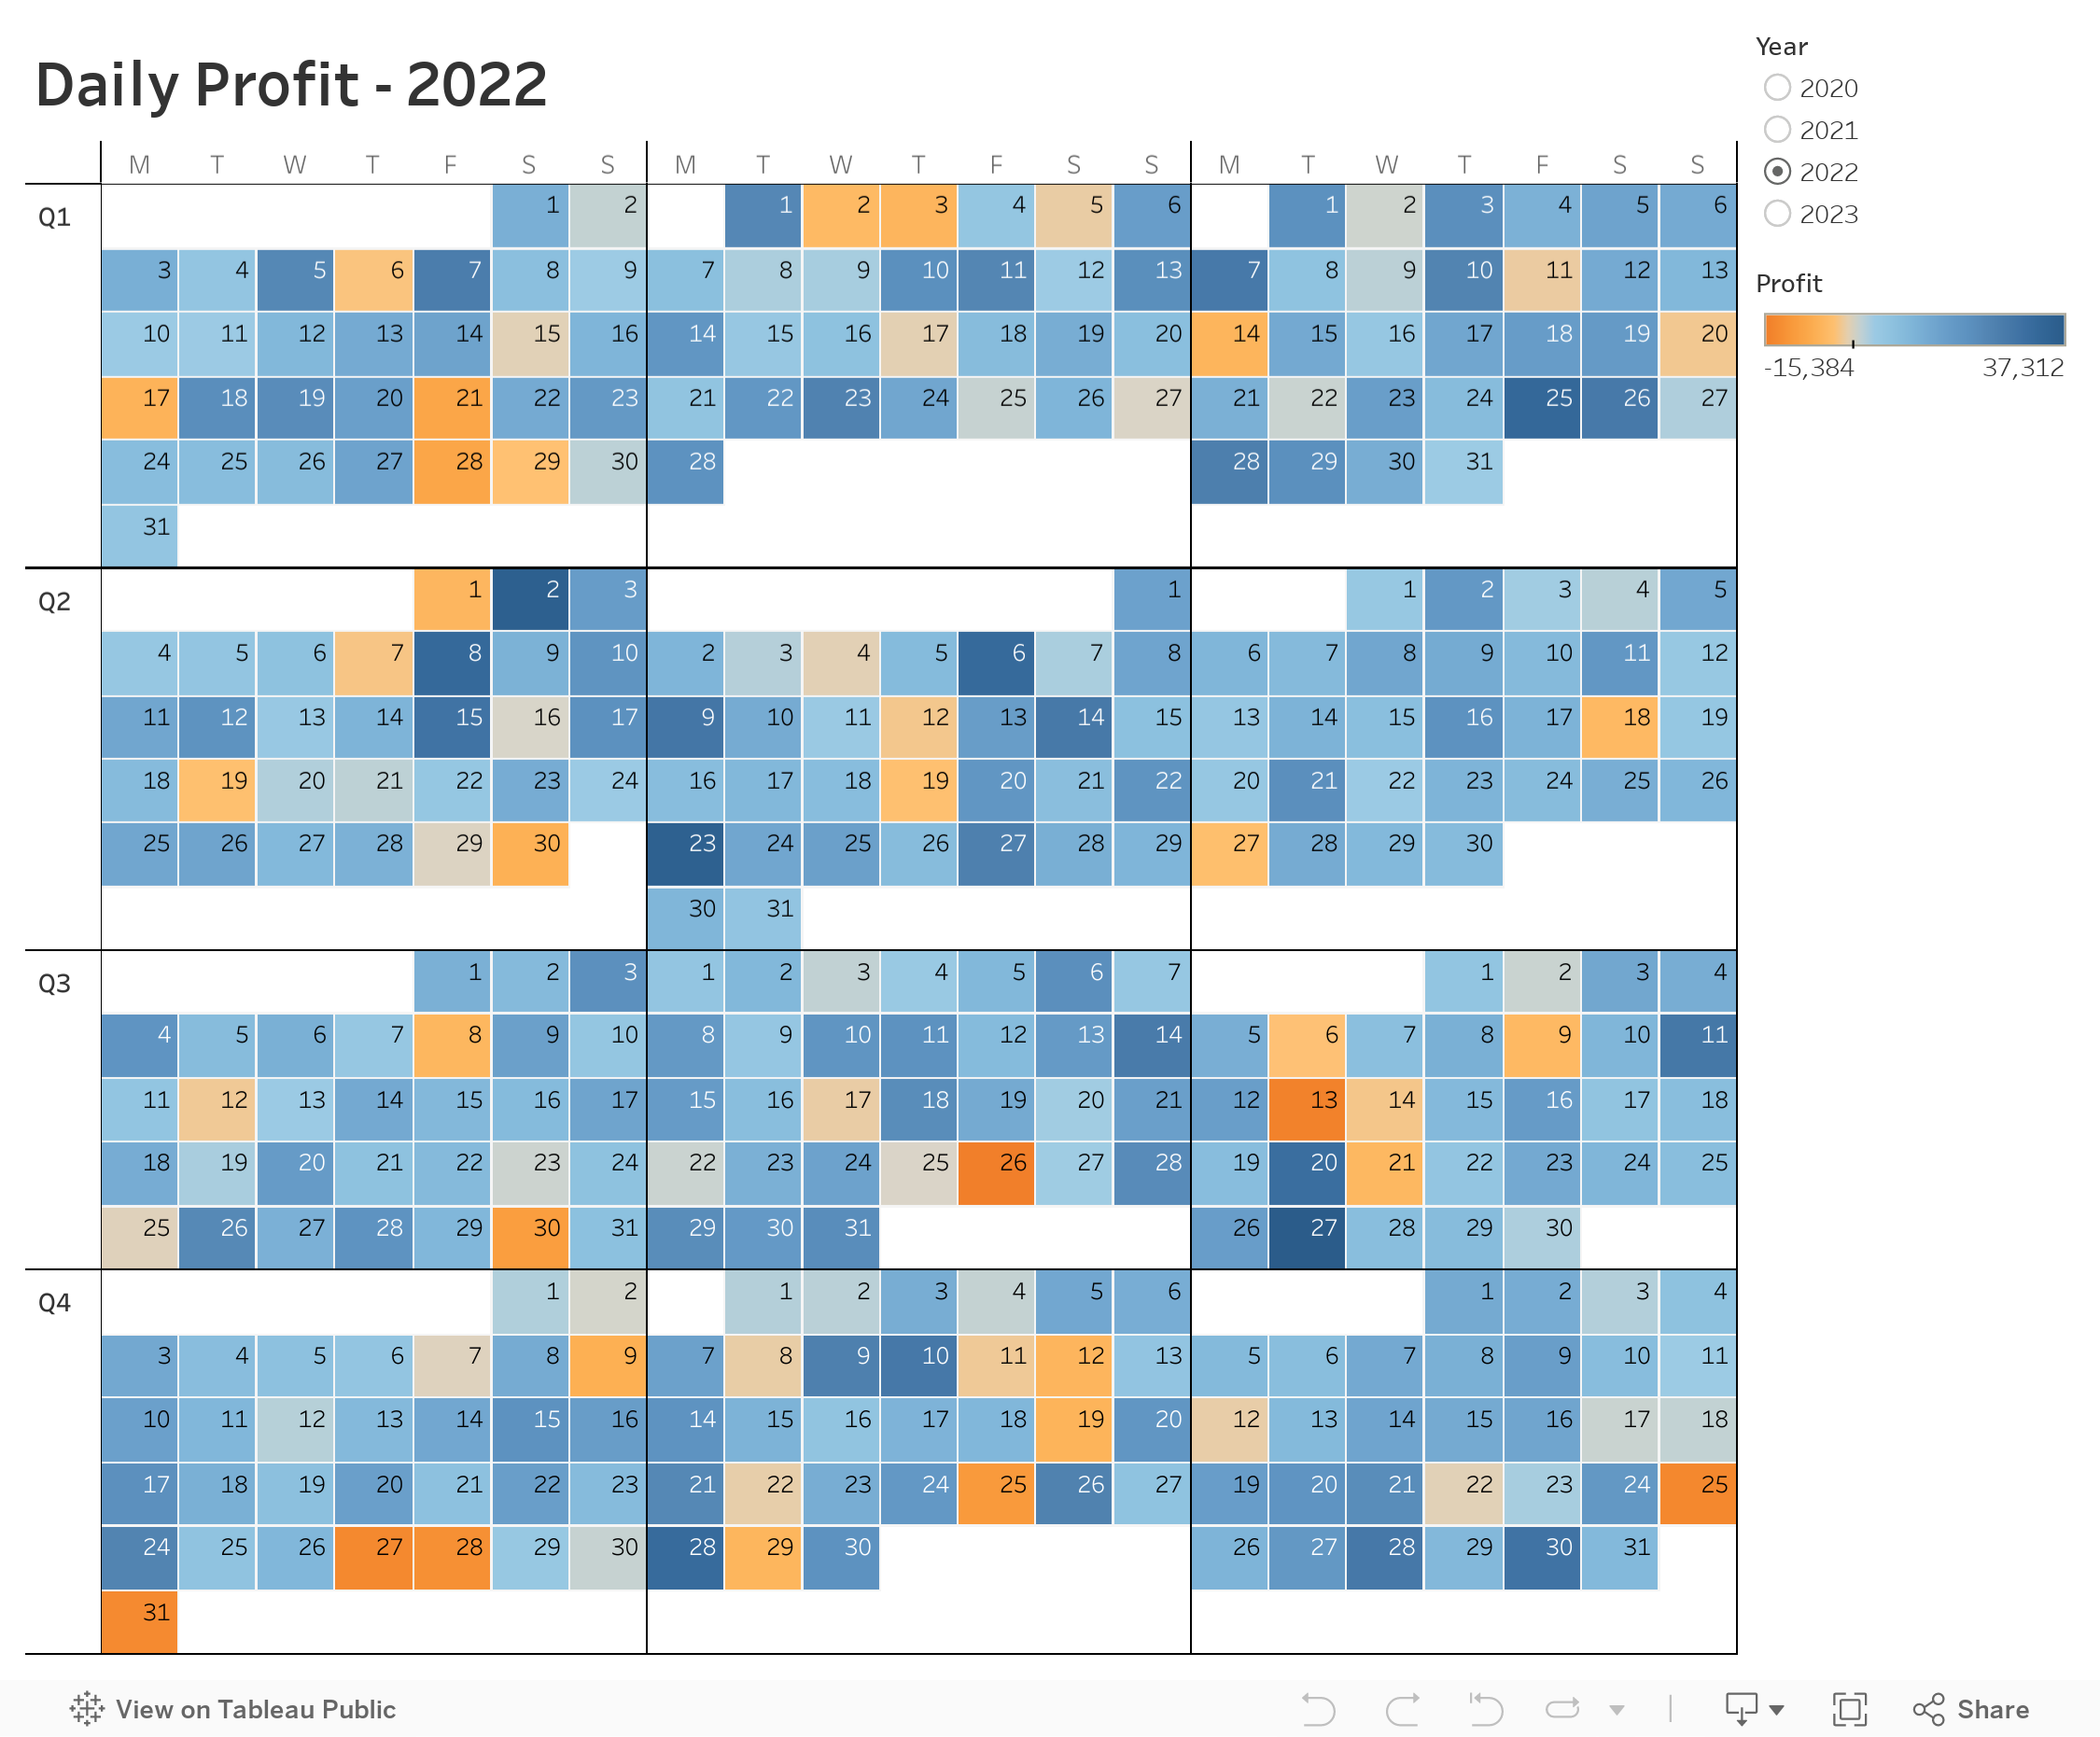
Welcome to this comprehensive tutorial on creating a Yearly to Monthly Calendar Drill Down using Dynamic Zone Visibility in Tableau.
📌 What You Will Learn
In this video, you'll discover how to use Tableau's Dynamic Zone Visibility feature to effortlessly switch between yearly and monthly calendar views. If you've been looking to add more flexibility and dynamism to your Tableau dashboards, this tutorial is designed for you.🔑 Key Takeaways
- Understand the concept of Dynamic Zone Visibility- Set up a yearly calendar view in Tableau
- Implement drill-down functionalities to transition to a monthly calendar view
- Practical tips and tricks for optimizing your Tableau dashboards
🔗 Additional Resources
- Data- Workbook
November 17, 2022
How to Create a 3 Level Scatterplot Drilldown
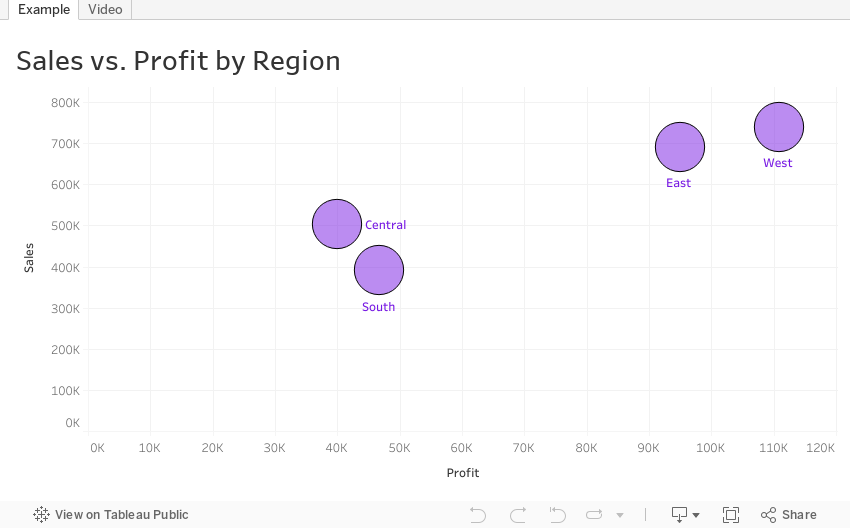
If you want to drilldown multiple levels in a scatterplot, this tip is for you. In this tip, I show you have to create a 3 level drilldown with a scatterplot.
Naturally after I showed how to create a 3 level bar chart drilldown, someone immediately asked how to do it with a scatterplot. Unlike the bar chart drilldown, the scatterplot will only show you marks for the current level.
For example:
- When I’m at the highest level, I see only regions.
- When I drill down one level, I only see States within the Region selected
- When I drill down one more level, I only see postal codes that are within the region and state I selected.
This example shows you how to drill down from Region to State to Postal Code. To use this for yourself:
- Download the workbook
- Copy all of the calculations into your workbook
- Swap out the dimensions
Note that you will need to recreate the sets and set actions. This will work with any combination of 3 dimensions.
October 25, 2022
How to Create a 3 Level Drill Down in Tableau
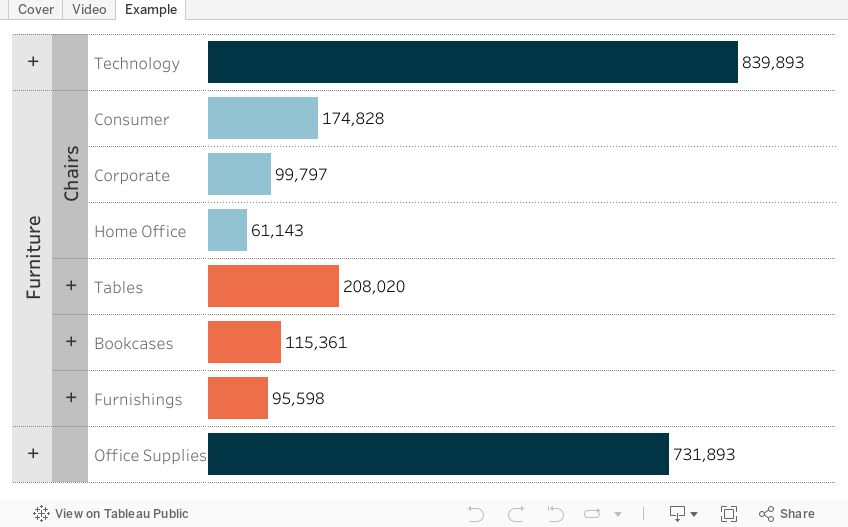
I've showed you in several videos and WatchMeViz live streams how to create a 2 level drill down. And naturally the follow up question is always, how can I go one level deeper? This tip has exactly what you're looking for. I show you how to create a 3 level drill down in Tableau.
This example shows you how to drill down from Category to Sub-Category to Segment. All you need to do for your situation is replace the dimensions I'm using with yours. This will work with any combination of 3 dimensions.
Check out the interactive version below the video.
This type is inspired by this example from Lindsey Poulter - https://public.tableau.com/app/profile/lindsey.poulter8872/viz/SetActionDrilldown/ChooseaMetric
January 18, 2022
How to Add a +/- Indicator to a Drill Down Action
December 7, 2021
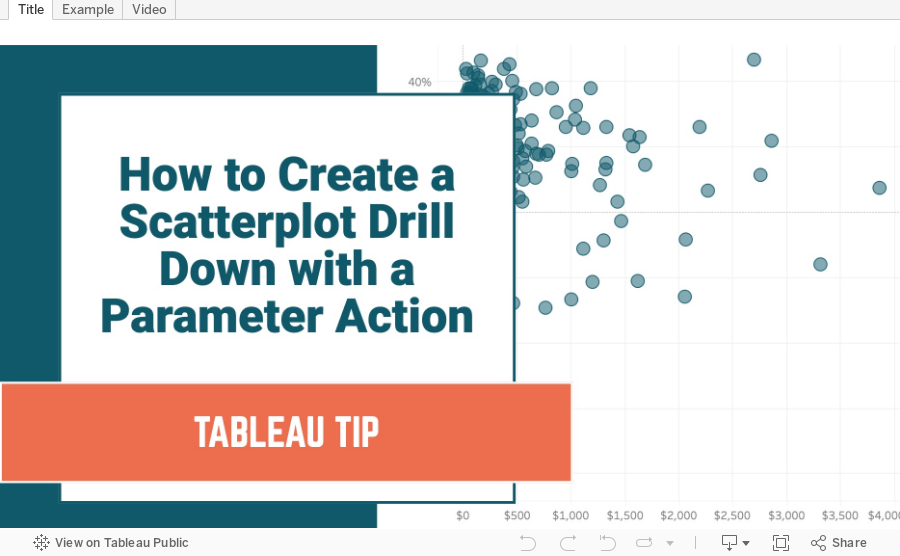
How to Create a Scatterplot Drill Down with a Parameter Action
In this example, I show you how to create an interactive scatterplot that allows the user to select a mark in a scatterplot to drill down to the underlying data. This tutorial shows you how to drill down from Sub-Category to Product. This process will work for any two dimensions.
May 12, 2021
How to Create a Time Series Drilldown with a Set Action

November 19, 2019
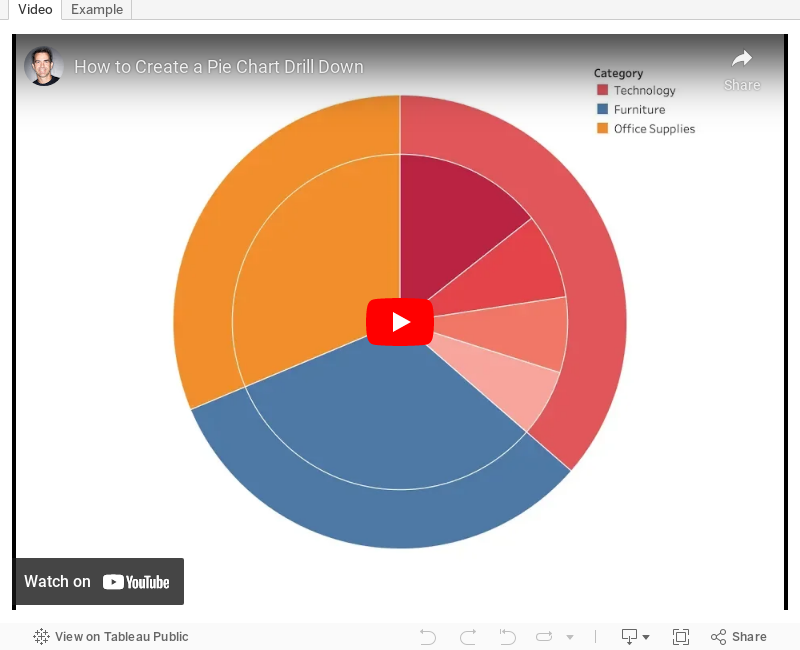
#TableauTipTuesday: How to Create a Pie Chart Drilldown