November 14, 2023
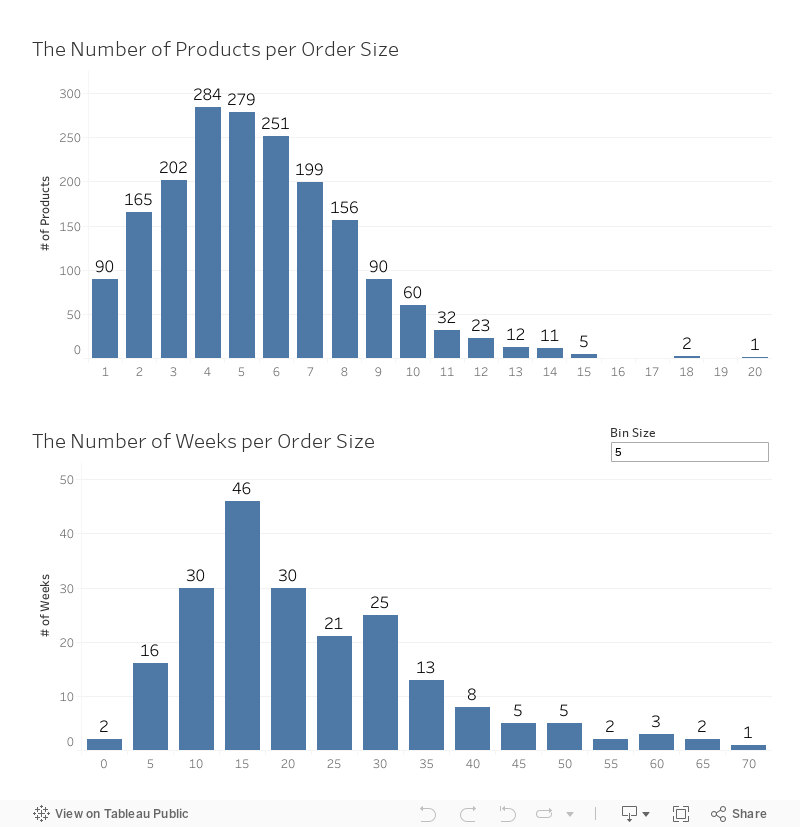
Harnessing Histograms for Data Analysis in Tableau

Explore the full spectrum of data visualization with Tableau histograms and the Data Guide feature!
This comprehensive video tutorial takes you on an exploratory journey from the basics of histograms to the advanced insights offered by Tableau's Data Guide.
In this instructional video, you will:
- Grasp the concept of histograms and their role in revealing data distributions.
- Tailor bin sizes and intervals in Tableau for customized data analysis.
- Utilize Tableau's Data Guide to enhance your understanding and interpretation of histograms.
- Apply your knowledge for practical learning.
Additionally, I'll walk you through the Data Guide in Tableau - a powerful feature that aids in decoding your data's story, ensuring you're not just seeing data but truly comprehending it.
By the end of this tutorial, you'll not only master the creation of histograms in Tableau but also leverage the full potential of the Data Guide to make informed decisions.
Download the workbook here.
October 31, 2023
How to Create a Year→Quarter→Month→Day Drilldown in Tableau

Are you looking to take your Tableau skills to the next level? Do you want to create dashboards that offer a dynamic and interactive experience?
Look no further!
This comprehensive tutorial will walk you through the process of creating a Year→Quarter→Month→Day Drilldown in Tableau.
🔹 What You'll Learn:
1. How to set up 2 parameters for drilldown functionality
2. How to perform 9 simple calculations that power your dashboard
3. How to implement 8 simple dashboard actions for enhanced interactivity
4. Introduction to dynamic zone visibility
🔹 Who Should Watch:
1. Data analysts looking to expand their Tableau toolkit
2. Business intelligence professionals aiming for dynamic reporting
3. Anyone who wants to unlock the full potential of Tableau
🔹 Why This Tutorial is Unique:
1. Step-by-step guide for each component: Parameters, Calculations, and Dashboard Actions
2. Introduction to advanced Tableau functionalities like dynamic zone visibility
3. Reusable examples to cement your understanding
4. Tips and tricks for maximizing the utility of your drilldowns
Don't miss out on upgrading your Tableau skills.
Let's dive into the world of advanced Tableau functionalities and take your dashboards to the next level!
October 24, 2023
Master Containers: Build an Interactive Tableau Dashboard From Scratch

October 17, 2023
Enhancing Tableau Drill-Downs: Use LODs in Hierarchies

Have you ever felt your drill-downs could be more insightful? Dive into this tutorial to see the magic of LOD expressions within hierarchies.
This will help us unlock deeper insights and makes data exploration even more insightful.
Whether you're well-versed in Tableau or just looking to level up your skills, there's something here for everyone.
Get the workbook - Link
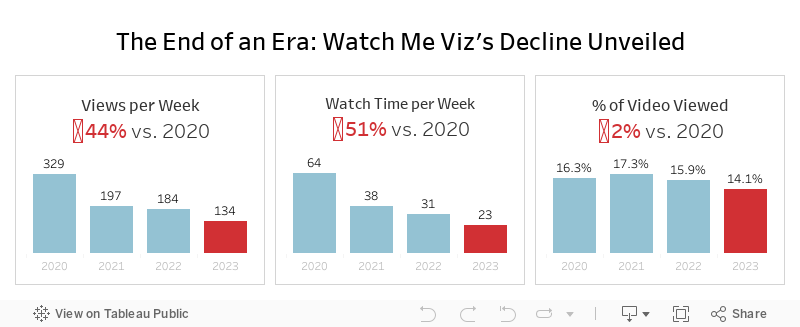
The End of an Era: Watch Me Viz's Decline Unveiled

That's a wrap. Watch Me Viz has retired, for good.
This week's data was about the performance of all of the WMV livestreams. There was some incredible viewer participation, which ultimately led to this viz that explains why WMV should quietly disappear.
Check out the livestream below.
October 10, 2023
Fix Your Broken Worksheet Actions in Tableau Dashboards

Ever wonder why your worksheet actions don't seem to play nicely when incorporated into a Tableau dashboard? You're not alone!
Everyone that starts using Tableau faces this hiccup, often leading to unnecessary hours of troubleshooting.
The answer is simpler than you think: change the worksheet action to a dashboard action!
In this tutorial, I'll walk you through this straightforward switch, step-by-step.
This will save you loads of time and frustration.
October 9, 2023
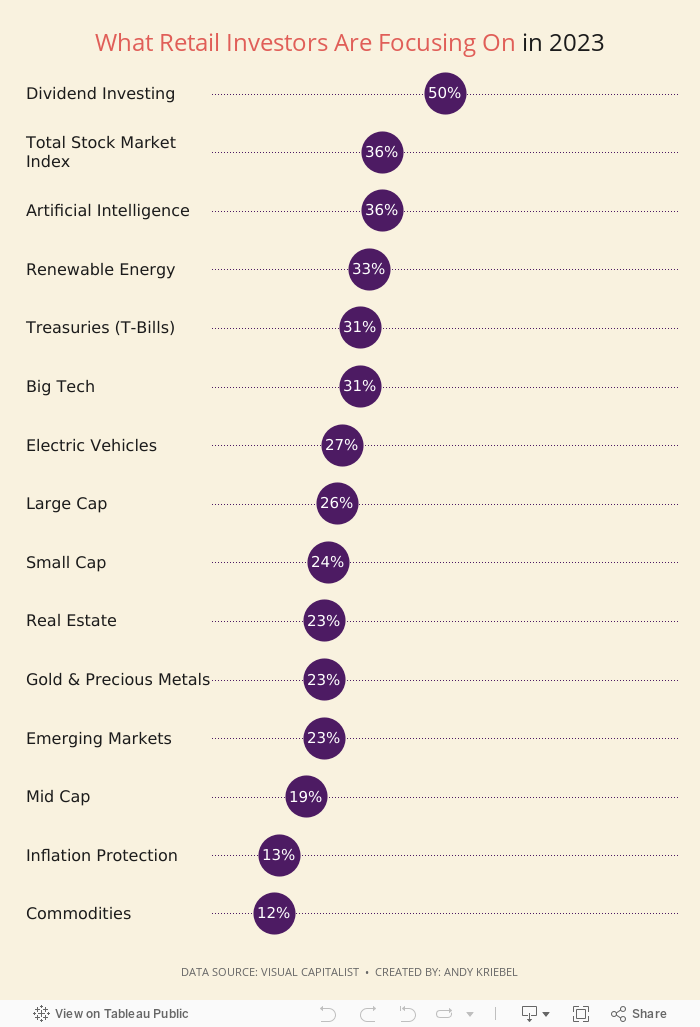
Behind the Chart Redesign: Retail Investment Step-by-Step Makeover

Catch up on my latest #MakeoverMonday Watch Me Viz. I dive into a step-by-step redesign of Visual Capitalists "What are Retail Investors Interested in Buying in 2023?" chart.
Starting with an overview of the original visualization, I review the gaps and areas for improvement. Why was a makeover necessary, and what potential did we see?
The livestream walks you through the entire transformation process, from the initial critique to the final touches.
Expect to uncover advanced design techniques and gain insights into the strategic thought process behind each decision.
Whether you're an aspiring designer or a seasoned data analyst, this step-by-step makeover promises valuable takeaways for all.
October 3, 2023
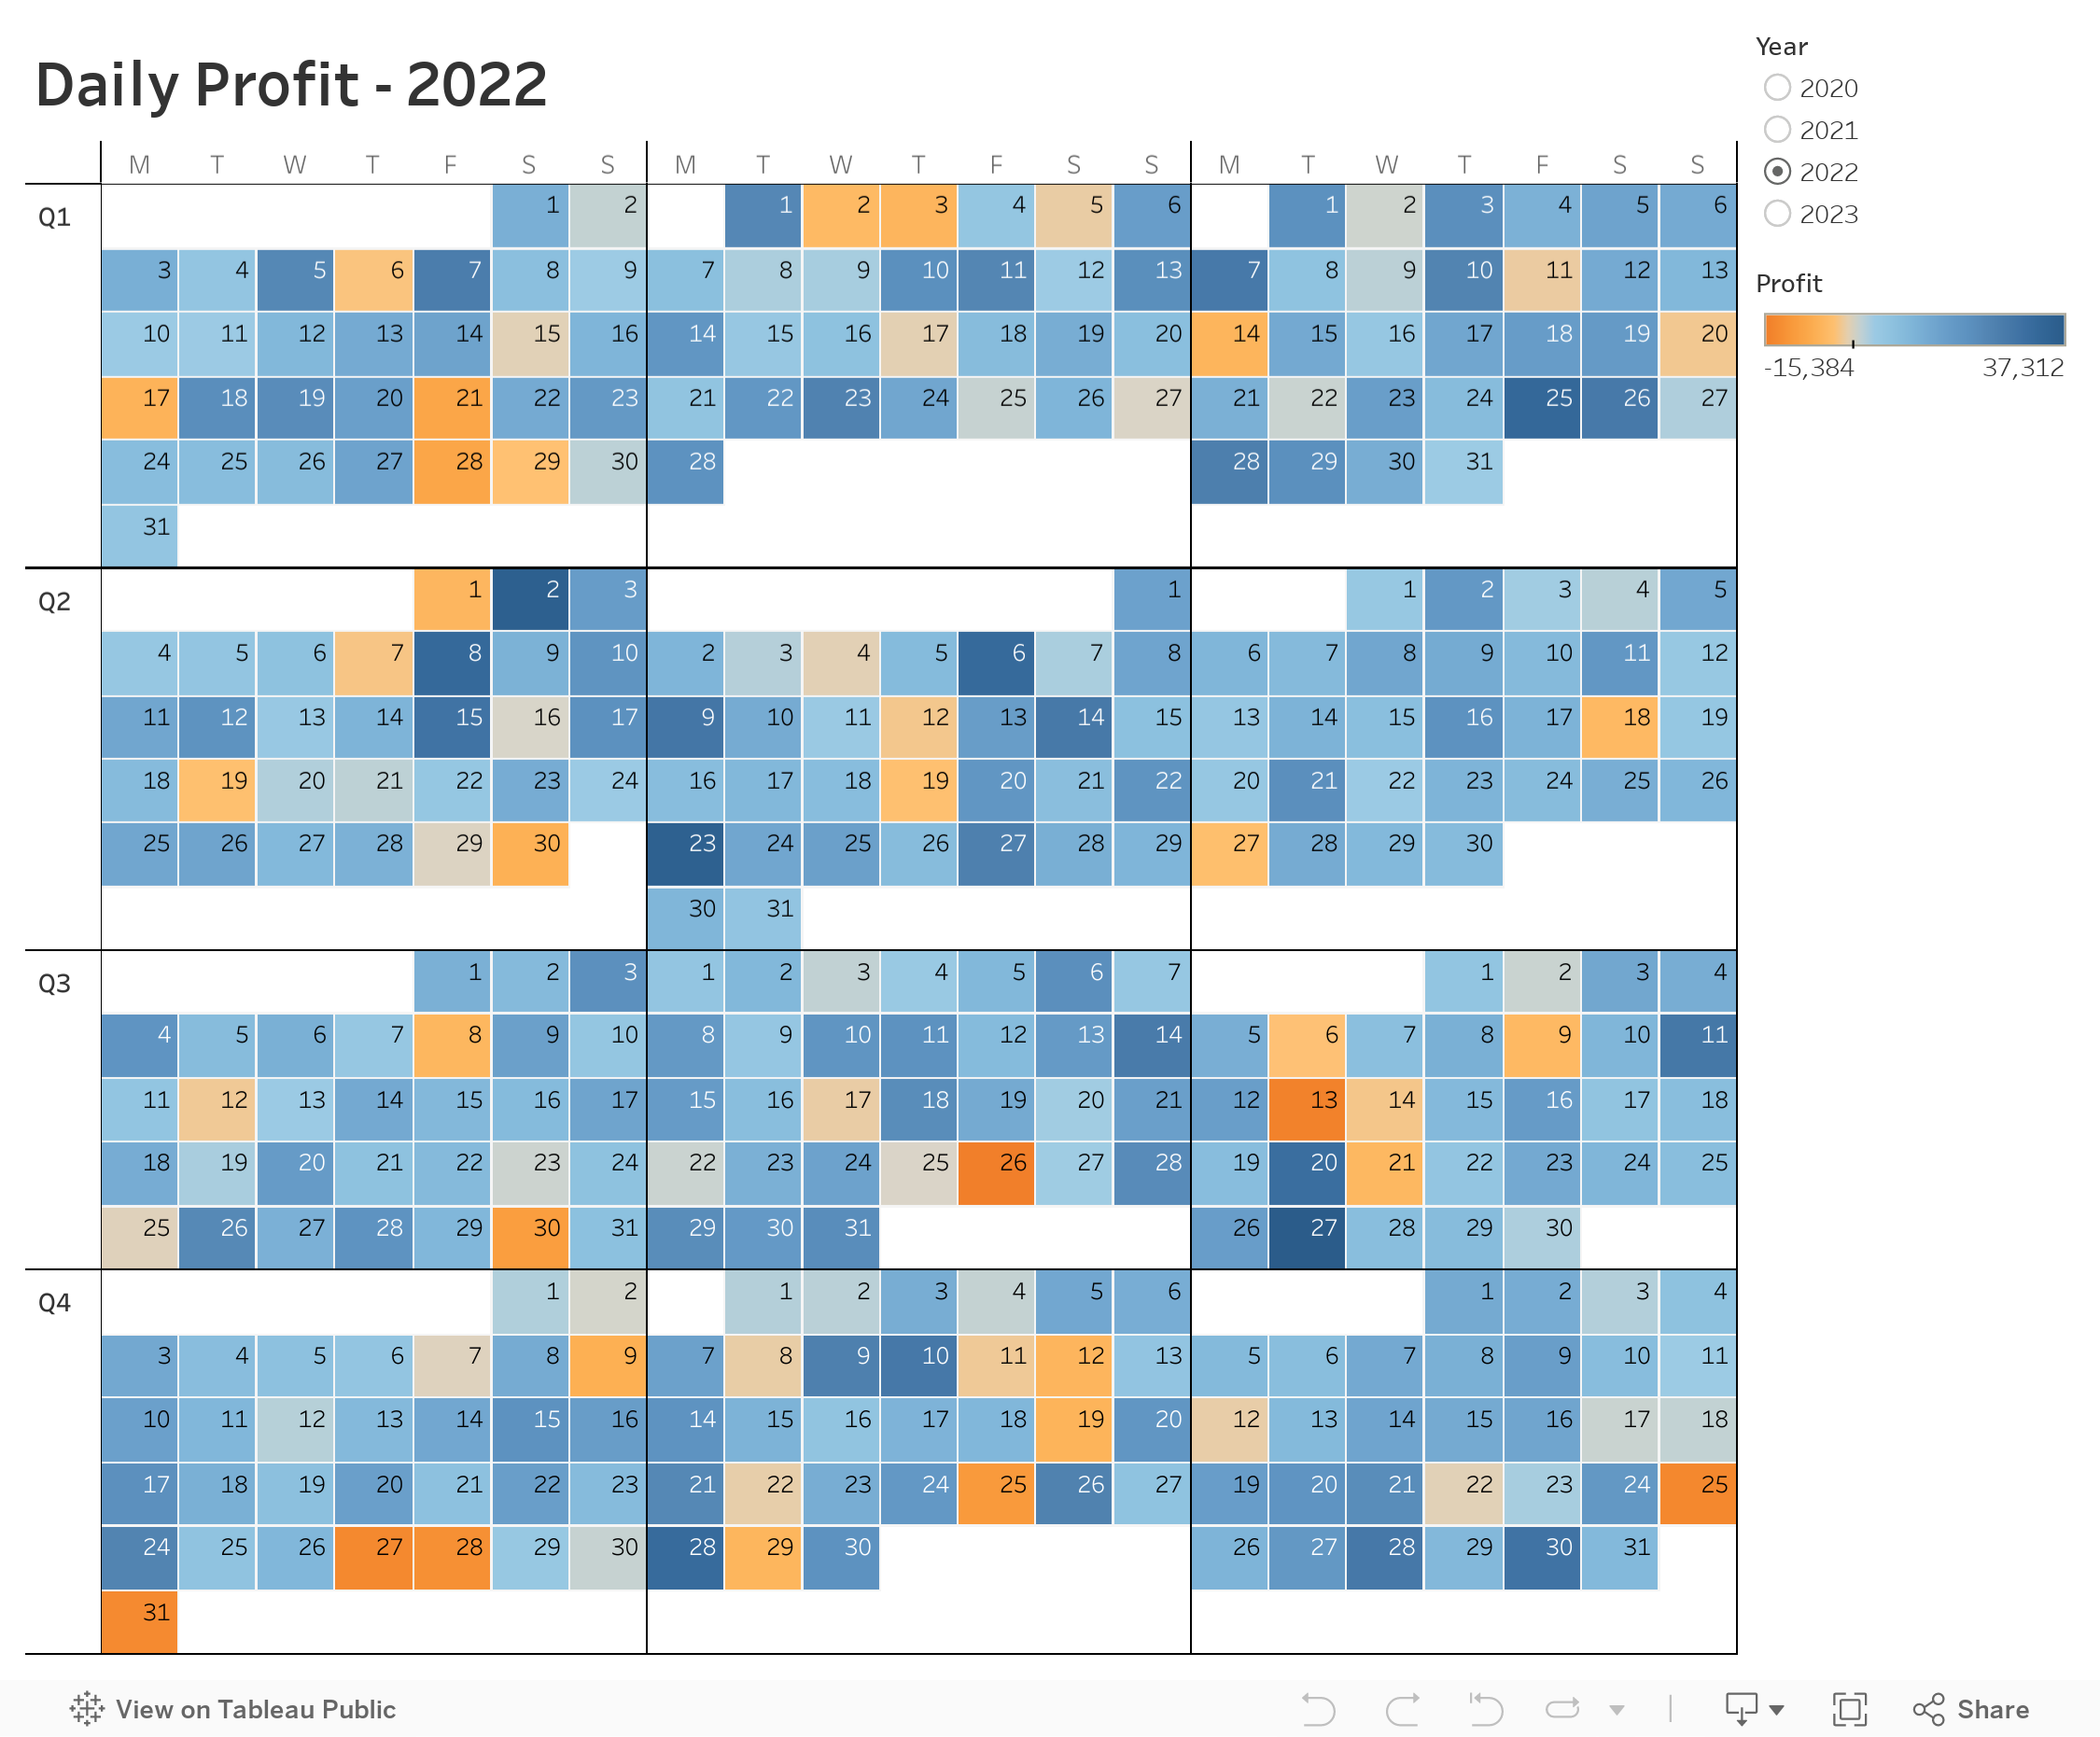
Master Dynamic Zone Visibility in Tableau: Yearly to Monthly Calendar Drill Down

Welcome to this comprehensive tutorial on creating a Yearly to Monthly Calendar Drill Down using Dynamic Zone Visibility in Tableau.
📌 What You Will Learn
In this video, you'll discover how to use Tableau's Dynamic Zone Visibility feature to effortlessly switch between yearly and monthly calendar views. If you've been looking to add more flexibility and dynamism to your Tableau dashboards, this tutorial is designed for you.🔑 Key Takeaways
- Understand the concept of Dynamic Zone Visibility- Set up a yearly calendar view in Tableau
- Implement drill-down functionalities to transition to a monthly calendar view
- Practical tips and tricks for optimizing your Tableau dashboards
🔗 Additional Resources
- Data- Workbook
September 26, 2023
Dynamic Drill-Down from Monthly to Daily Data Using Set Actions

Unlock the power of Tableau's Set Actions to enhance your data visualizations!
In this in-depth tutorial, I'll walk you through a step-by-step guide on how to create an interactive chart that allows users to drill down from monthly to daily data by simply clicking on a month.
Ideal for analysts, business intelligence professionals, and anyone who wants to level up their Tableau skills.
What You'll Learn:
- How to set up Set Actions in Tableau
- Create interactive charts for effective data exploration
- Best practices for visualizing monthly and daily data
Who This is For:
- Data Analysts
- Business Intelligence Professionals
- Tableau Beginners and Enthusiasts
Prerequisites:
- Basic understanding of Tableau Desktop
Resources:
- Download the sample workbook: https://public.tableau.com/app/profile/andy.kriebel/viz/MonthtoDayDrillDown/Sheet1
- Data: https://data.world/vizwiz/sample-soda-sales
- Tableau official documentation on Set Actions: https://help.tableau.com/current/pro/desktop/en-us/actions_sets.htm
September 19, 2023
Mastering 4-Level Map Drill Downs in Tableau

If you've enjoyed my previous tutorials on 2-level and 3-level drill downs in Tableau, prepare to take your skills to the next level.
I've got something unique for you: a step-by-step guide on creating a 4-Level Map Drill Down in Tableau!
What You'll Learn:
- How to drill down from a region to a state
- How to further drill down from a state to a county
- Finally, how to drill down from a county to a city
Prerequisites:
This is an advanced tutorial. Make sure you're comfortable with Tableau basics and have seen my 2-level and 3-level drill down videos.
Previous Videos:
2-Level Drill Down Tutorial
- https://www.vizwiz.com/2022/08/two-level-drill-down.html
- https://www.vizwiz.com/2023/06/map-drill-down.html
3-Level Drill Down Tutorial
- https://www.vizwiz.com/2023/08/dzv-drilldown.html
Links & Resources:
Workbook - https://public.tableau.com/app/profile/andy.kriebel/viz/4-LevelMapDrilldown/MapDrilldown
September 12, 2023
How to Calculate Weekday-Only Sales in Tableau

Have you ever wondered how to compare sales performance between two sets of weekdays?
In this video, I'll show you how to calculate and compare sales for the last 10 weekdays against the prior 10 weekdays—all while excluding weekends.
What You Will Learn:
- Setting up your data source for comparison
- Creating calculated fields for two sets of weekdays
- Configuring table calculations to get only the days you need
- Filtering out weekends from both data sets
- Implementing advanced date functions for comparison
- Visualizing and comparing sales for both sets of weekdays
Background Context:
Tableau enables you to conduct intricate data analyses, but comparing specific sets of weekdays can be tricky. This tutorial simplifies that process, focusing on comparing the last 10 weekdays' sales with the 10 weekdays preceding them.
Assumptions:
- You have a foundational knowledge of Tableau.
- Your sales data contains date information.
- You've previously worked with calculated fields in Tableau.
Related Videos:
Resources:
- Workbook & data: Link
#MakeoverMonday Week 37 - First time home buyers in the UK are being shut out of the market

September 5, 2023
60 Unique Ways to Visualize Time in Tableau

September 4, 2023
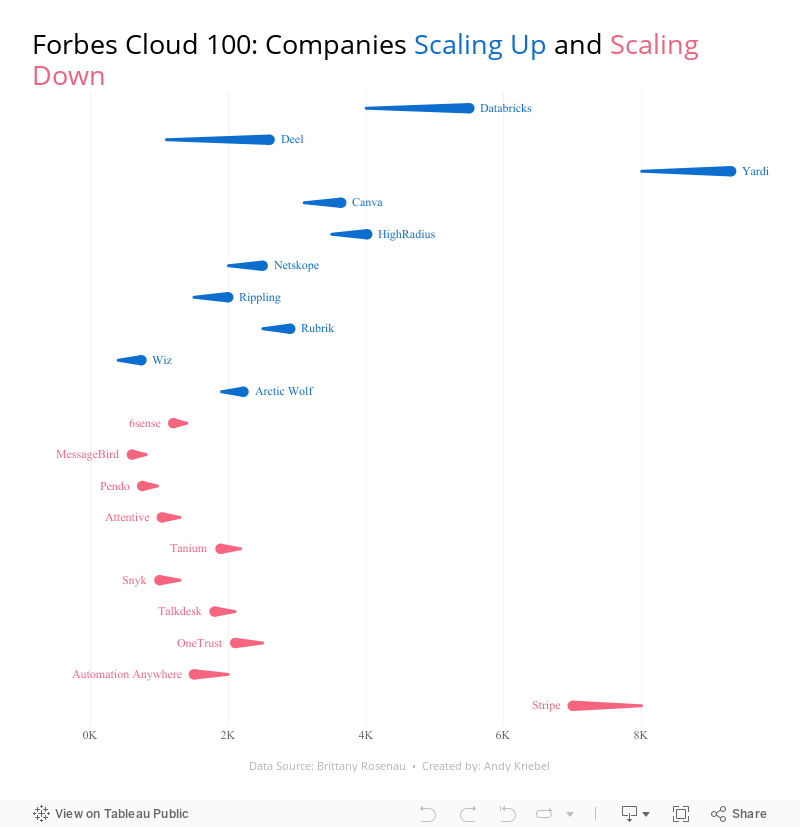
28 Charts in 60 Minutes - Forbes Cloud 100: Companies Scaling Up and Scaling Down

How many people power the Forbes Cloud 100? Is there a correlation between company rank and employee size? Have they expanded or contracted.
Learn how to build 28 charts in 60 minutes that compare two years.
August 29, 2023
How to Compare YTD, QTD, MTD, WTD & Daily Sales in Tableau

August 23, 2023
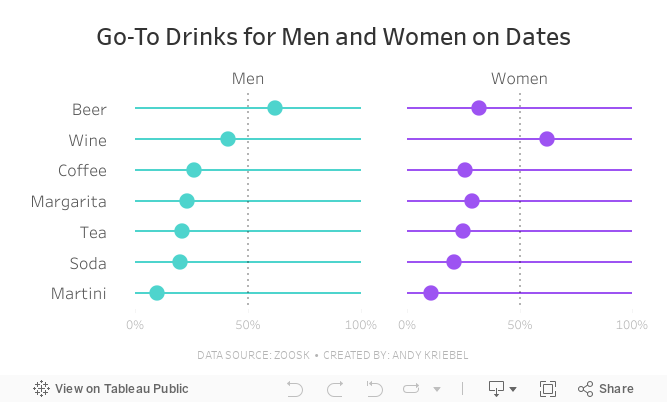
#MakeoverMonday Week 34 - Go-To Drinks for Men and Women on Dates

Join me for live analysis of Zoosk's recent survey, covering 8,793 members' dating drink preferences!
In this livestream, I'll break down the responses across 7 different drink types, comparing the preferences between men and women.
Is there a gender divide when it comes to what people choose to drink on dates?
I'll explore this question and more.
August 22, 2023
From Boring PowerPoint to Dynamic Tableau with Microsoft Web Viewer

August 15, 2023
An 8-Chart Guide to Dashed Lines in Tableau

In this tip learn when to use of dashed lines. Through this video, I'll walk you through 8 distinct examples, demonstrating the effectiveness and clarity that dashed lines can bring to your data representation:
- Line Chart with Dashed Elements: Understand the basics of creating dashed lines.
- Multiple Lines Differentiation: Explore how to distinguish multiple measures using varied dashed patterns.
- Line/Area Chart Combination: Integrate dashed lines with filled areas.
- Comparison to a Moving Average: Learn how dashed lines can contrast raw data against its moving average, helping in trend analysis.
- Current Year vs. Prior Year: Used dashed lines to make year-on-year comparisons.
- Combination Chart: Combine several chart types, using dashes to maintain clarity.
- Barbell Chart Analysis: Learn how dashes can link data points in a barbell chart, highlighting change and consistency.
- Forecast vs. Actuals: Create a forecast with dashed lines.
August 8, 2023
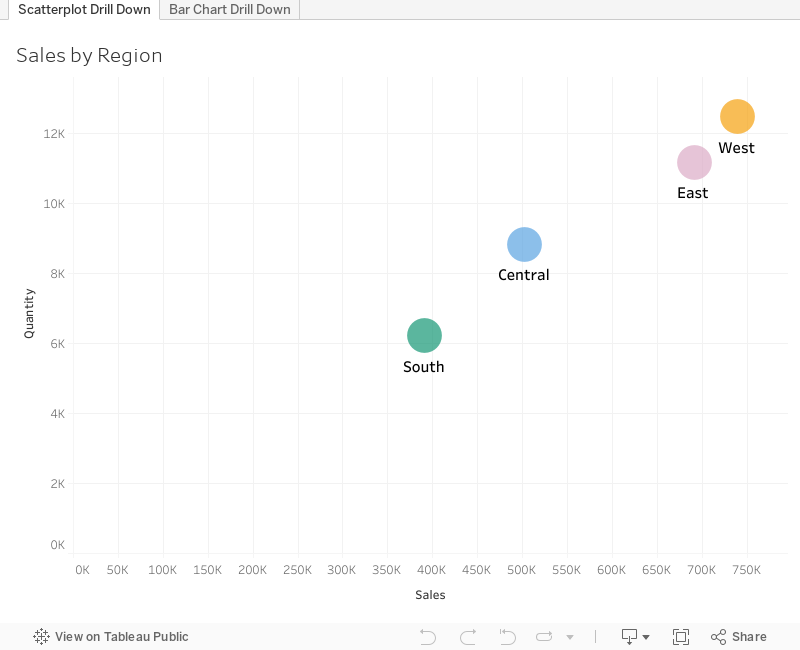
How to Master the 3-Level Drill Down in Tableau (with Dynamic Zone Visibility)

Welcome to my guide on mastering the 3-Level Drill Down in Tableau!
In this tutorial, I show you step-by-step how to make the most of using dynamic zone visibility to create this functionality. We'll go through both scatter plot drill downs from Region → State → Postal code and then replicate that as a bar chart.
You can easily make this a map drill down by changing the chart type. That's it!
🔍 What you'll learn in this video:
1. The basics of drill down functionality in Tableau
2. Hands-on demonstrations, tips, and best practices
3. How to interact with the data
💡 Why is this important?
Drill down capabilities allow analysts to explore data from a broad overview down to granular details. By mastering the 3-level drill down, you can uncover hidden patterns, insights, and trends that might be overlooked in higher-level analyses.
📌 Prerequisites:
A basic understanding of Tableau's interface and primary functions will be helpful, but beginners will be able to follow along as well!
If you are following along, be sure to pause the video along the way as you repeat the steps.
August 7, 2023
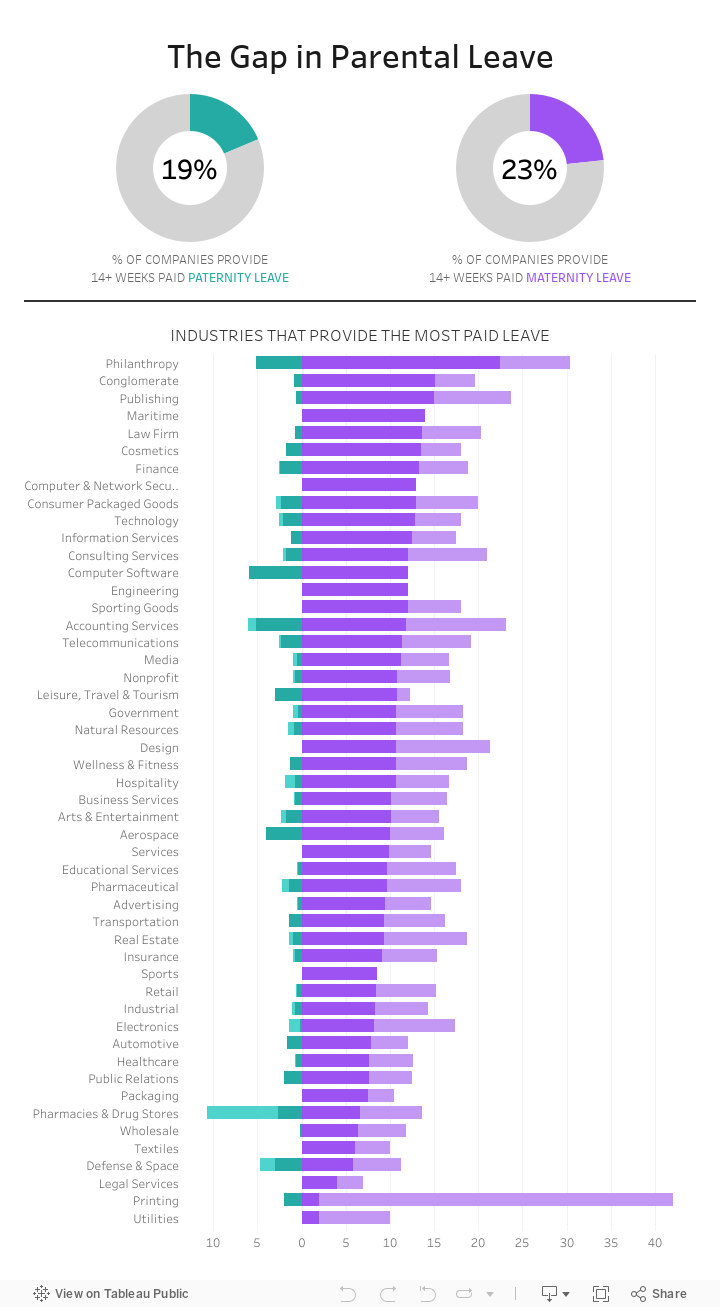
#MakeoverMonday Week 32 - The Gap in Parental Leave

The gap in parental leave is extremely wide across all industries in America.
How do only 23% of women get 14+ weeks of maternity leave? Why isn't progress being made to help dads take a more active role?
Check out the livestream recording and interactive viz below.
August 1, 2023
How to Use ANY Tableau Public Dashboard as a Template for FREE!

Have you ever spotted a great dashboard on Tableau Public and wished you could repurpose it for your own data?
Look no further! 🌟
In this video, I'll guide you through the easy steps of using dashboards on Tableau Public as templates.
From downloading the workbook to swapping out the data and troubleshooting errors, learn how to quickly create dashboards in minutes.
Note: Ensure that you're respectful of original creators' work and provide appropriate credits or mentions when using their dashboards.
Get the data and python code to create your own mock data here - Link
Priya Padham's dashboard - Link | My dashboard - Link
July 31, 2023
#MakeoverMonday 2023 Week 30 - Drinking Fountains in Milan

You'll learn about:
- Joining spatial data sources
- Parameters
- Hexbin maps
- Custom shapes
- Using mapbox maps
- Dashboard layout containers
- Dynamic Zone Visibility
- Parameter Actions
- Custom colors
- Drill down / drill up actions
Enjoy the video and check out the viz below.
July 25, 2023
The Big Thaw: Exploring the Disappearing Antarctic Sea Ice

- Visualizations from chapter 12 of the Makeover Monday book that showed how to add context to visualizations
- Several of the vizzes from 2018 week 15, each with their own unique take on the data
- The original viz by The Guardian
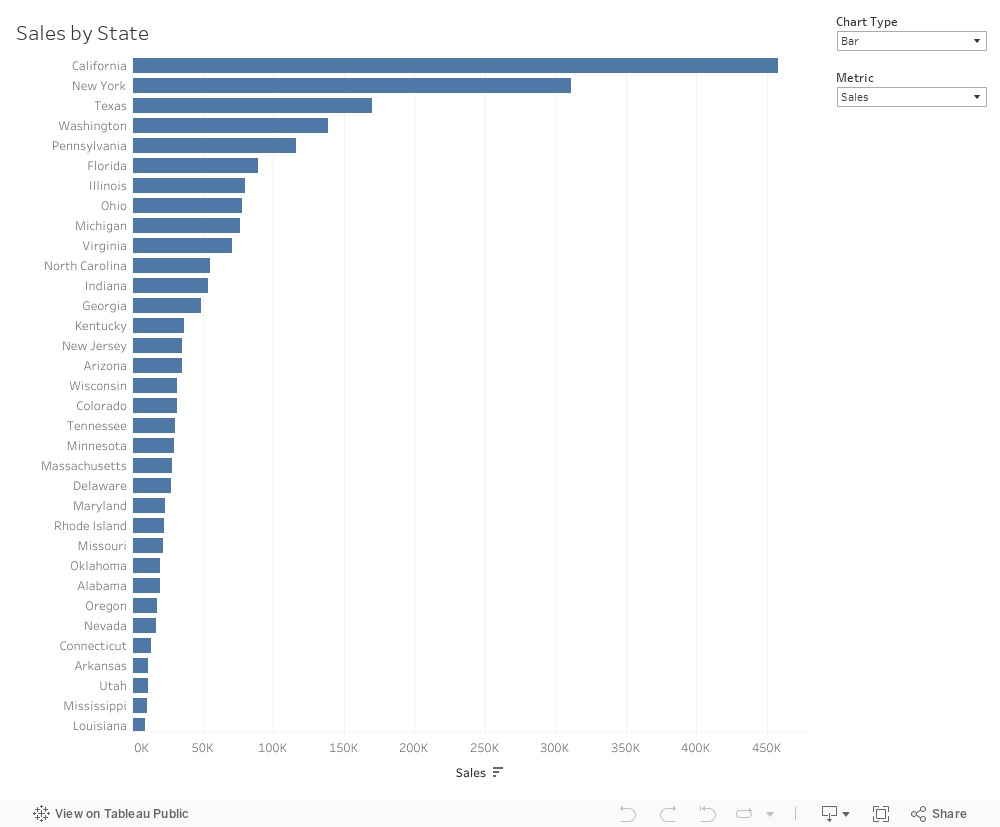
18 Ways to Create Bar Charts in Tableau

In this comprehensive Tableau tutorial, I will explore 18 different ways to create bar charts using Tableau. This video is inspired by Rosa Mariana de Leon-Escribano, my colleague at The Information Lab France.
In this tutorial, I will use various techniques to build bar charts that will help you visualize your data effectively. Whether you are a beginner or an advanced Tableau user, this video is designed to cater to all skill levels.
Throughout the video, I will guide you step-by-step, demonstrating each method so that you can follow along. I will help you understand when to use each type based on your data requirements.
By the end of this tutorial, you will have a solid foundation in creating bar charts in Tableau and be equipped with the knowledge to choose the appropriate bar chart type for your data analysis needs.
Rosa's bar chart catalog - Link | My bar chart catalog - Link
July 18, 2023
UNLIMITED Charts, Metrics, and Number Formats in Tableau with Dynamic Zone Visibility