Showing posts with label butterfly. Show all posts
April 3, 2024
September 4, 2023
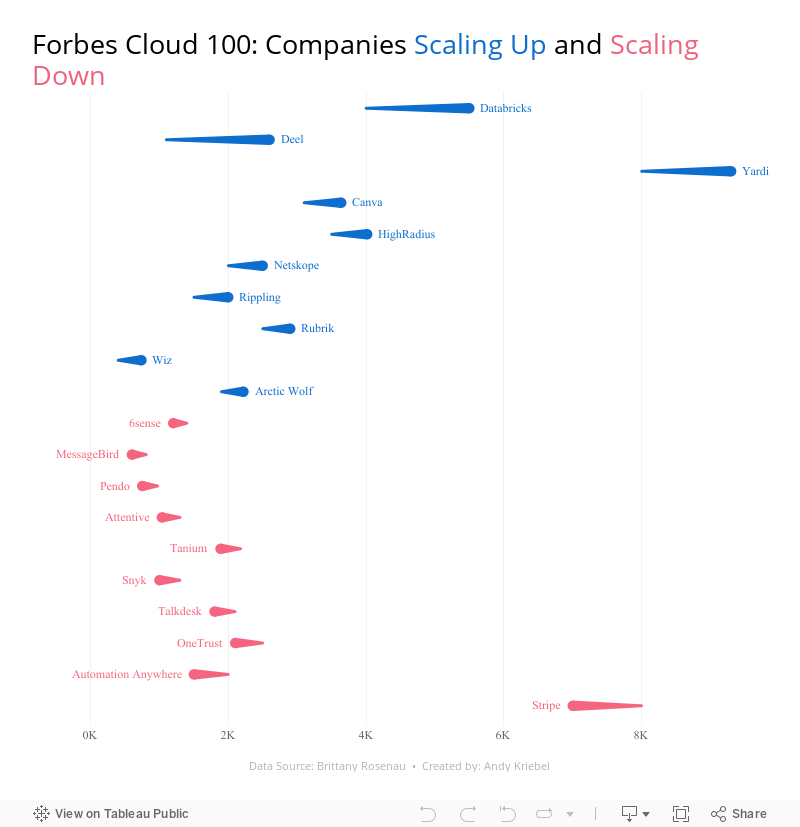
28 Charts in 60 Minutes - Forbes Cloud 100: Companies Scaling Up and Scaling Down
bar chart
,
bar in bar
,
barbell
,
bullet graph
,
butterfly
,
comet
,
comparison
,
dashboard
,
floating bar chart
,
how to
,
lollipop
,
Makeover Monday
,
scatter plot
,
seismogram
,
slope graph
,
tableau
,
tadpole
,
variance
No comments

How many people power the Forbes Cloud 100? Is there a correlation between company rank and employee size? Have they expanded or contracted.
Learn how to build 28 charts in 60 minutes that compare two years.
Subscribe to:
Posts
(
Atom
)