November 14, 2023
Harnessing Histograms for Data Analysis in Tableau

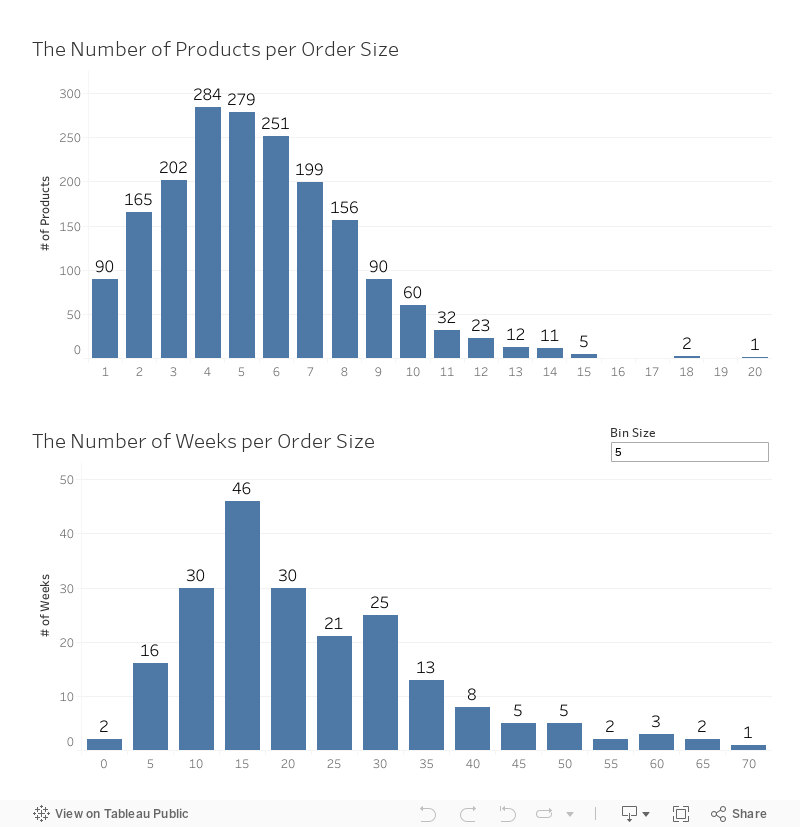
Explore the full spectrum of data visualization with Tableau histograms and the Data Guide feature!
This comprehensive video tutorial takes you on an exploratory journey from the basics of histograms to the advanced insights offered by Tableau's Data Guide.
In this instructional video, you will:
- Grasp the concept of histograms and their role in revealing data distributions.
- Tailor bin sizes and intervals in Tableau for customized data analysis.
- Utilize Tableau's Data Guide to enhance your understanding and interpretation of histograms.
- Apply your knowledge for practical learning.
Additionally, I'll walk you through the Data Guide in Tableau - a powerful feature that aids in decoding your data's story, ensuring you're not just seeing data but truly comprehending it.
By the end of this tutorial, you'll not only master the creation of histograms in Tableau but also leverage the full potential of the Data Guide to make informed decisions.
Download the workbook here.