September 28, 2020
#MakeoverMonday 2020 Week 39 - Child Marriage Around the World
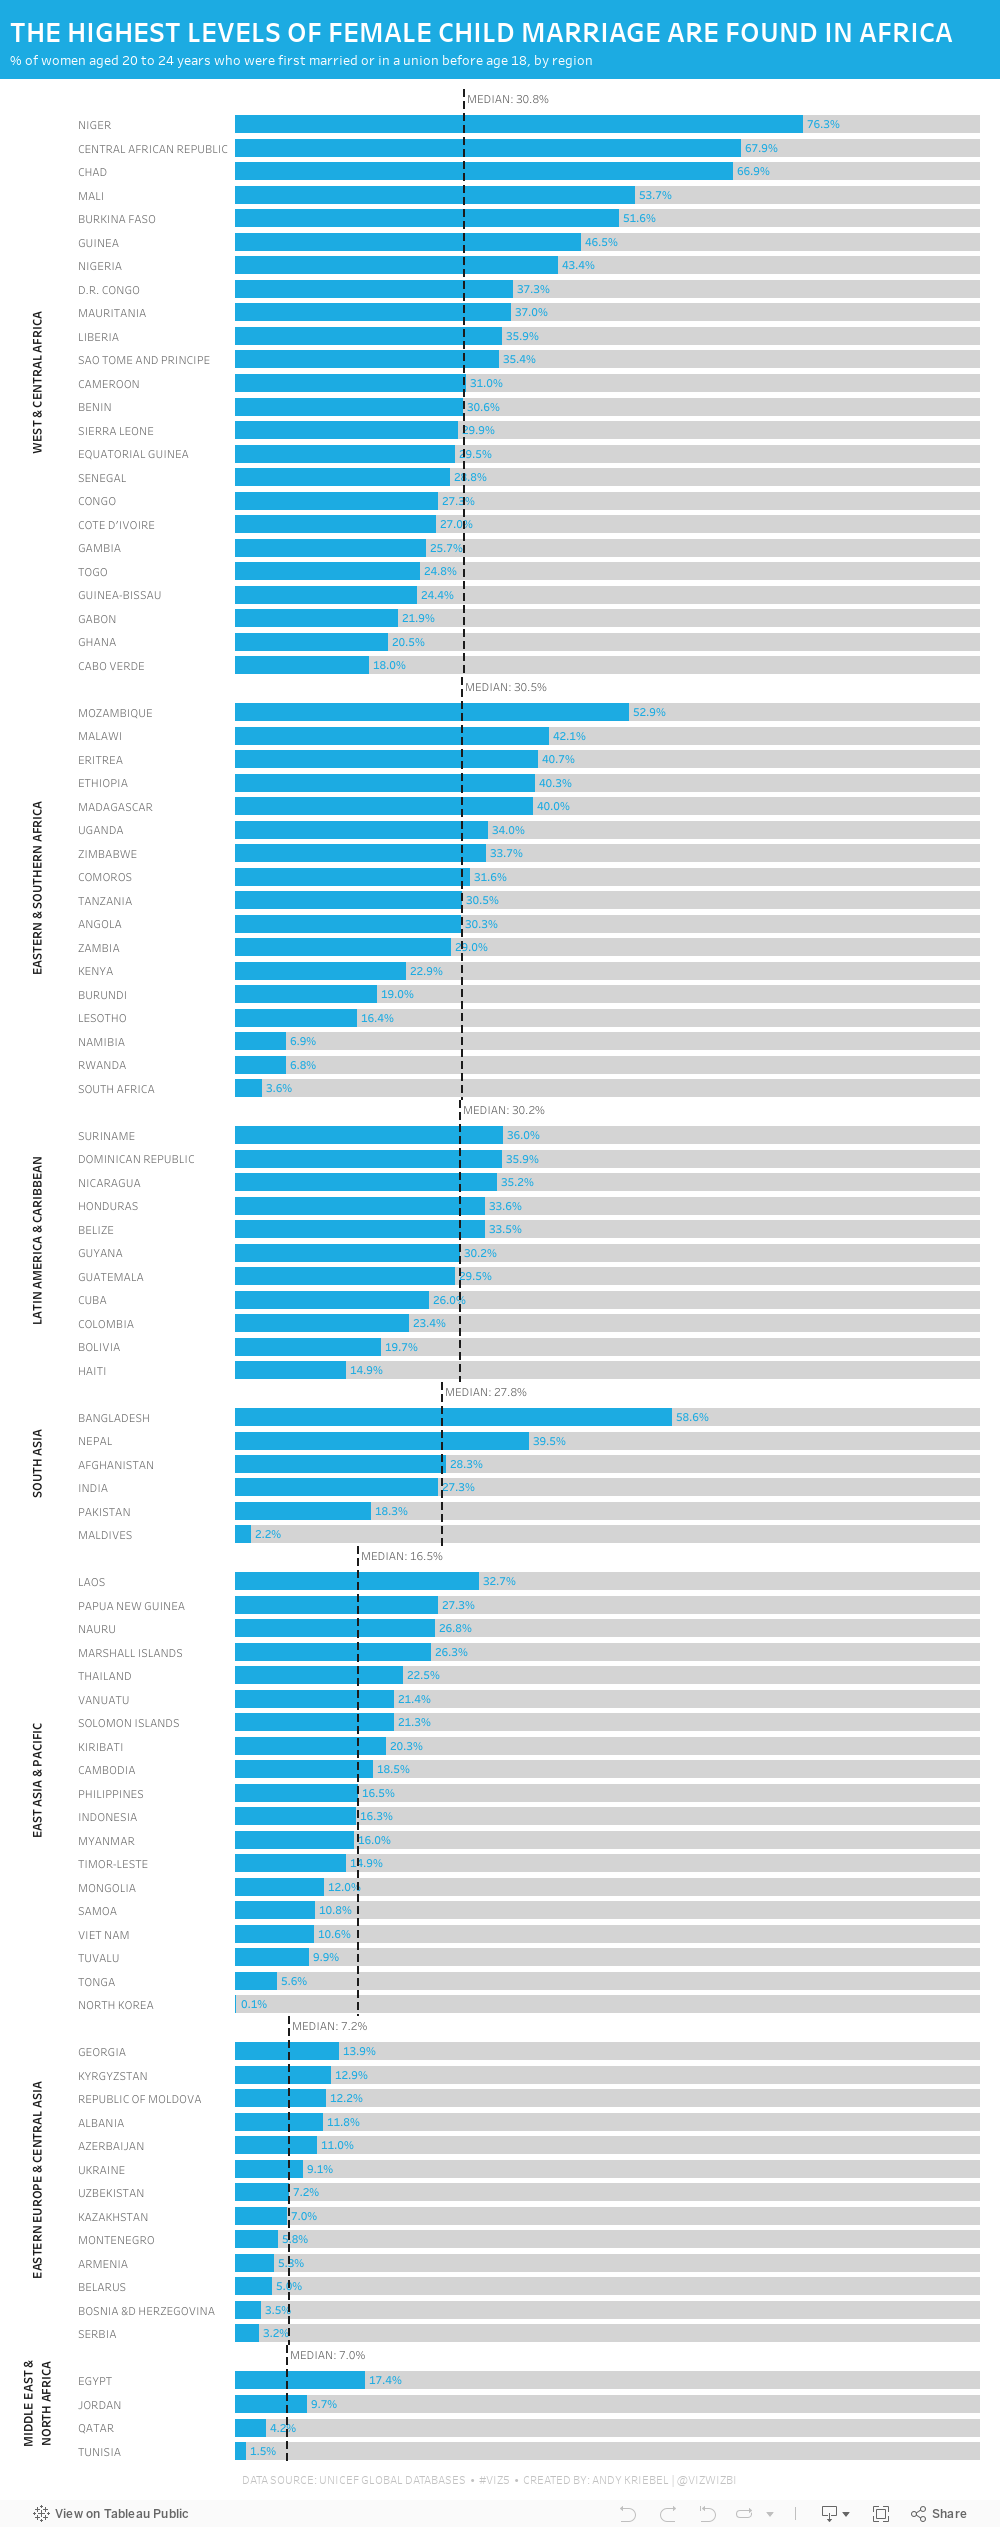
Week 39 brought another #Viz5 topic, this time it was about children that are now 20-24 who were married under the age of 18. Child marriage is, of course, horrific and it's a violation of human rights. Unicef has done an excellent job of recapping all of the issues and why these marriages happen on their website here.
As I've mentioned before, I ALWAYS find these Viz5 data sets tought. I'm not sure why; perhaps I have a mental block on them now. This week the data set was three columns: country, female %, and male %. That can't be too tough...right?
Well, I sure made it tough. First, I joined the data to regional mappings from Unicef so that I could possibly look at the data at the regional level; I decided to use medians for each region in the end. Then I went into Tableau and built a bunch of charts to explore the data. I used chart guides to help me think through options and none of them seemed to make any particularly interesting insights pop out.
After about two hours of nothing, I got the idea of simply looking at the % of females that were married under the age of 18. I ended up with a simple bar chart, which turned out to not be too far from the first chart I created a few minutes in.
Here's the #WatchMeViz video and below is the visualization. Thanks to those that watched live and contributed ideas along the way!! It really helps knowing others are there encouraging me.

September 25, 2020
#WorkoutWednesday 2020 Week 3: Orders by Day and Time
As time permits, I'm going back through some of the Workout Wednesday challenges that I've yet to complete. I'm starting with those that will help me most as a teacher to impart what I learn on those that I have the pleasure to train at The Data School.
For week 3, Lorna Brown challenged us to create a viz that shows the number of orders by hour of the day that allows the user to swap between day of the month and weekday.
In her solution, she chose to create two sheets, one for the day of the month and another for weekdays. I didn't know that when I tackled the challenge so I proceeded down the route of doing it all in one sheet. Success!
I did a couple things differently than Lorna:
- I combined the order date and time into a string calculation and then used the DATEPARSE function to make it a date/time field.
- The size of my circles depends on the option selected in the parameter. For day of the month, the size is the number of orders. For weekday, I have them set to a fixed size. I chose to make them a fixed size because otherwise the circles become way too big for the view.
- I used only one sheet.
- I am not showing a tooltip when there are no orders.

September 22, 2020
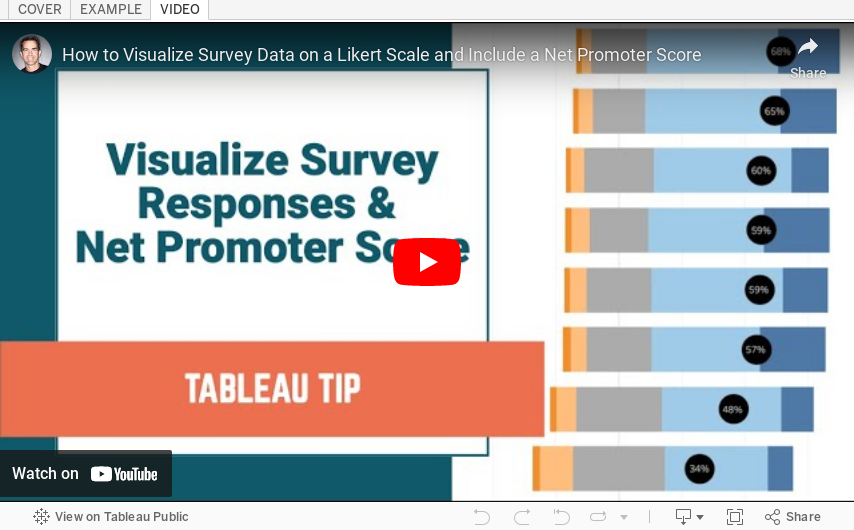
#TableauTipTuesday: How to Visualize Survey Data on a Likert Scale and Include a Net Promoter Score

We've all answered Likert scale questions. These are questions like "How likely are you to recommend our product?" and they are typically on a five point scale (e.g., from not at all to very highly likely).
In this video, I show you how to visualize Likert scale data and how to include a Net Promoter Score (NPS). To get the data that I used, simply download the workbook and unzip it. You will then see a folder named "Data".
Useful links:
1. What is a Likert Scale? http://bit.ly/LikertSurveyMonkey
2. What is a Net Promoter Score? https://www.netpromoter.com/know/
September 21, 2020
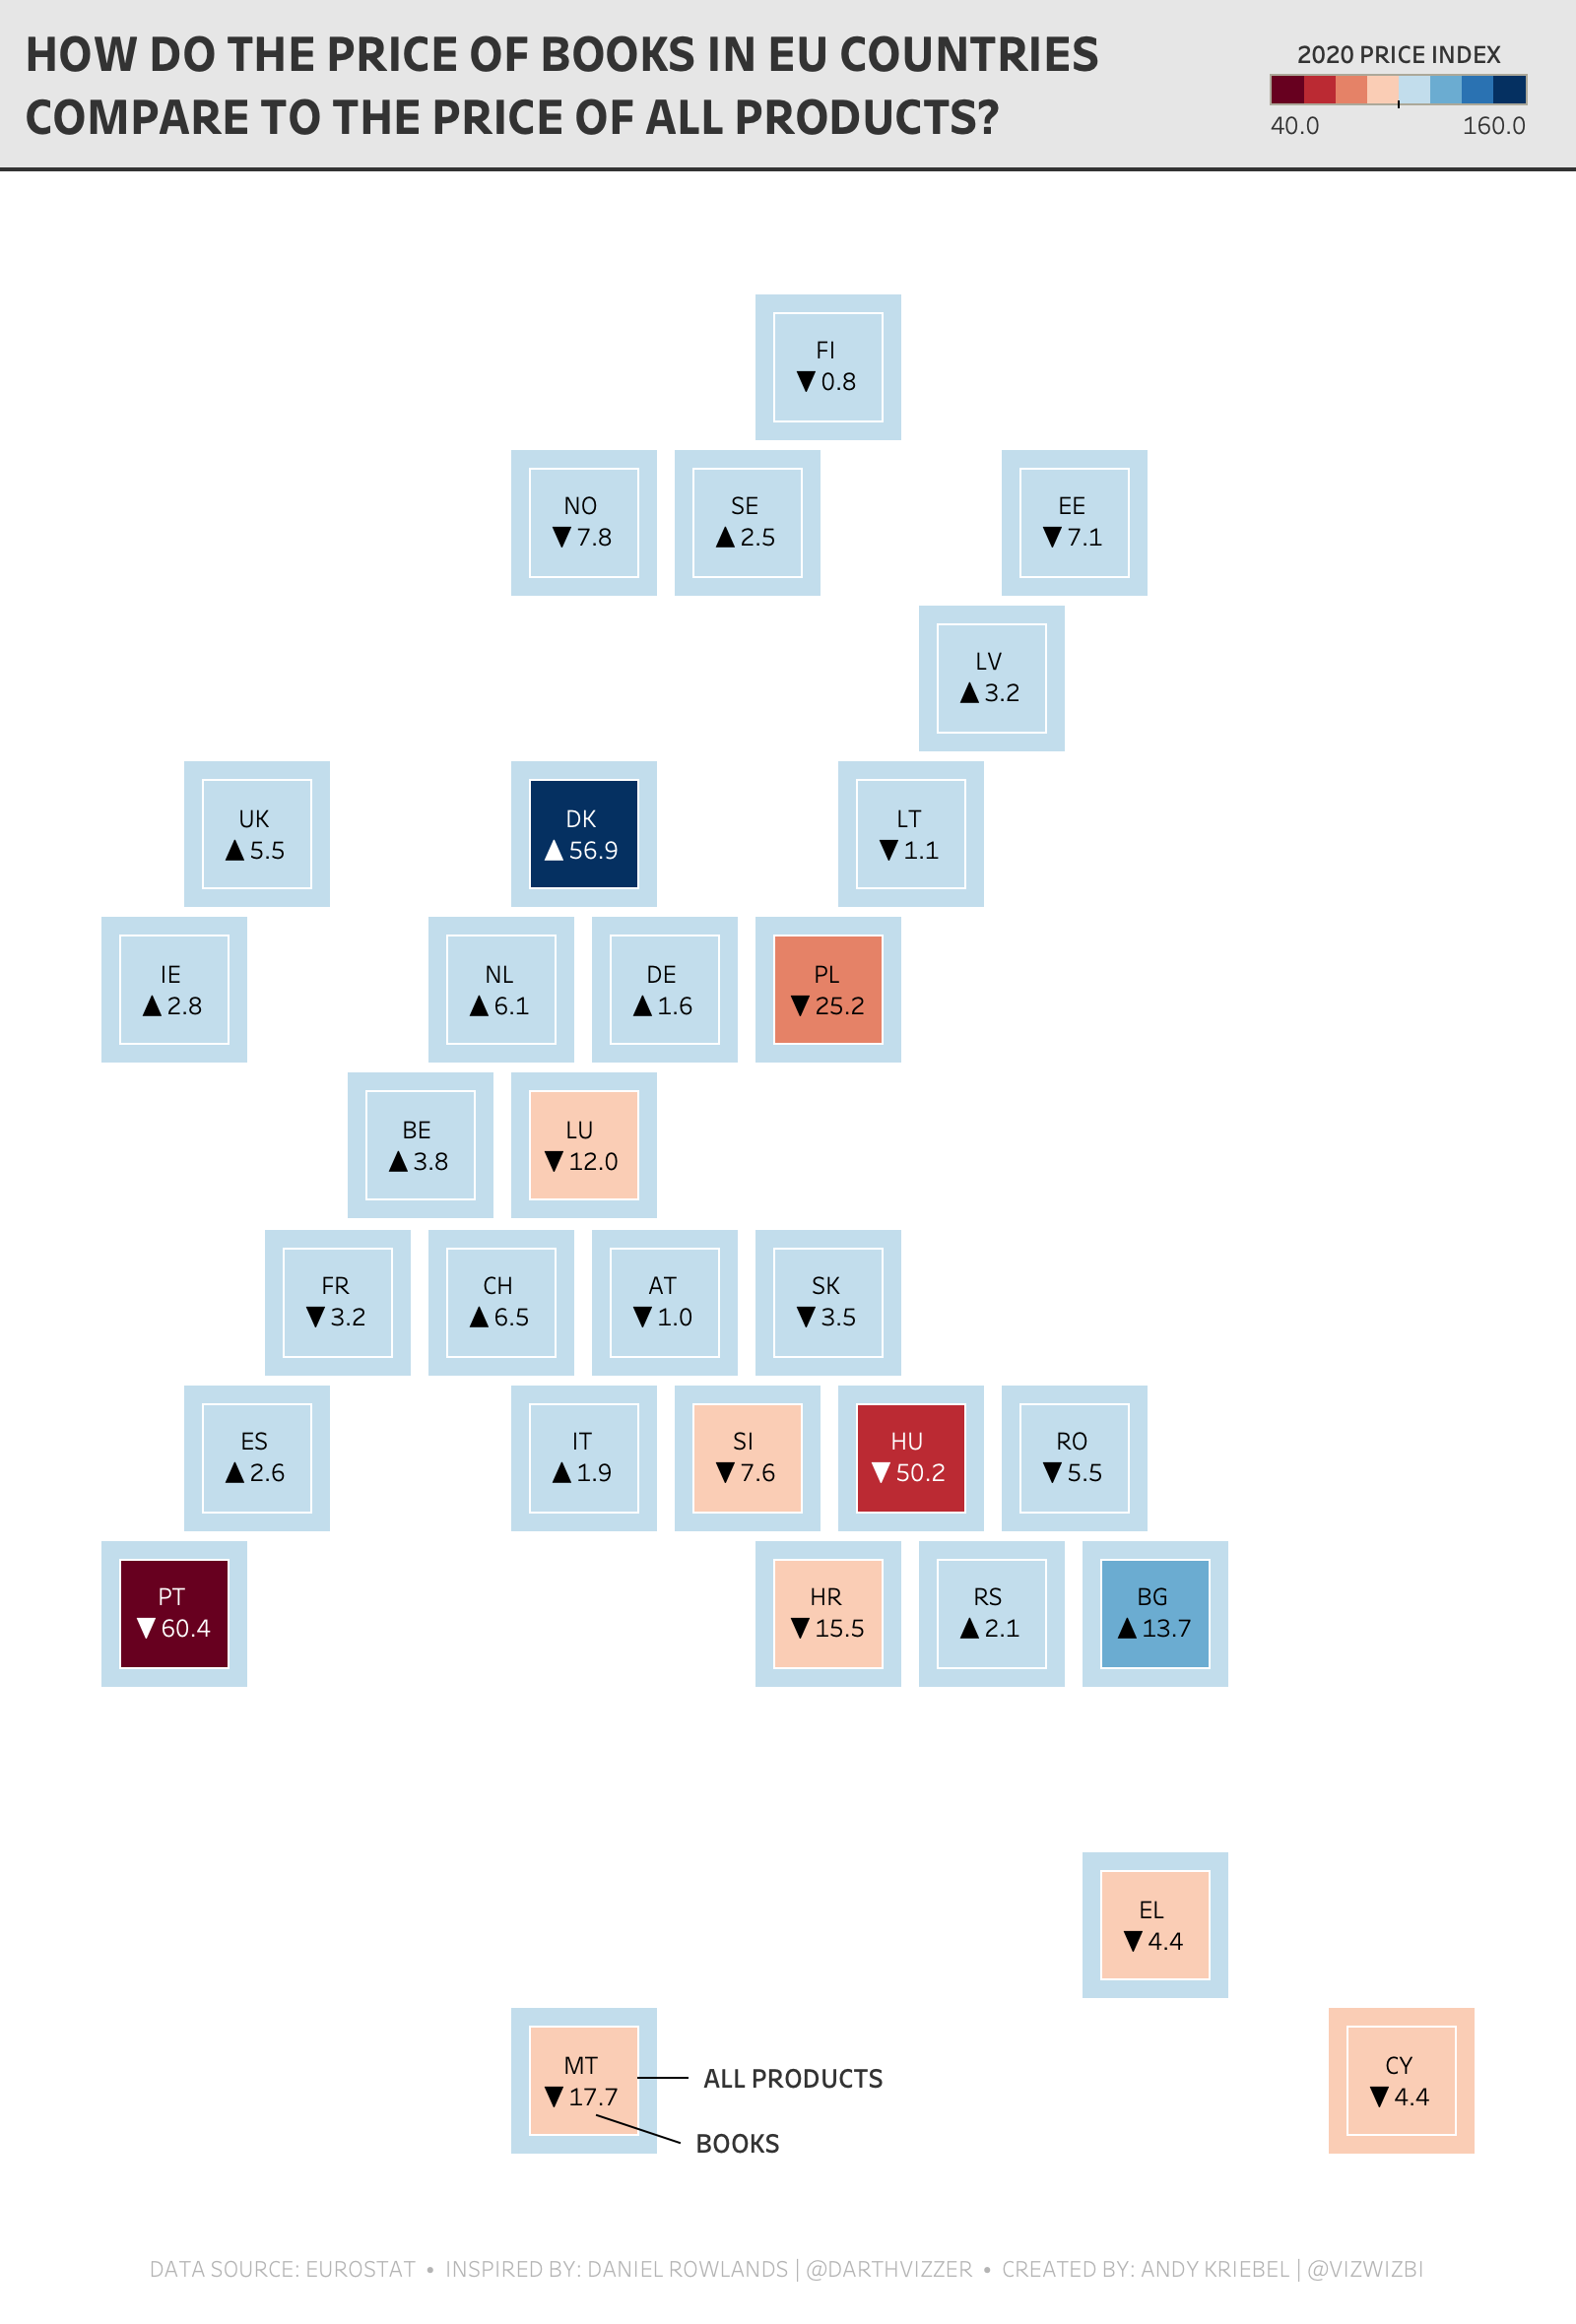
Watch Me Viz - #MakeoverMonday 2020 Week 38 - Pick Up A Book And Read
- Geometrics shapes (for the default number formatting) - LINK
- FIXED Level of Detail Expressions in a Plain English Sentence - LINK
- TABLE CALCULATIONS in a Plain English Sentence - LINK
- Shading between two lines - LINK
- Daniel Rowlands - TWITTER
- Daniel Rowlands (EU hex map template) - LINK
September 9, 2020
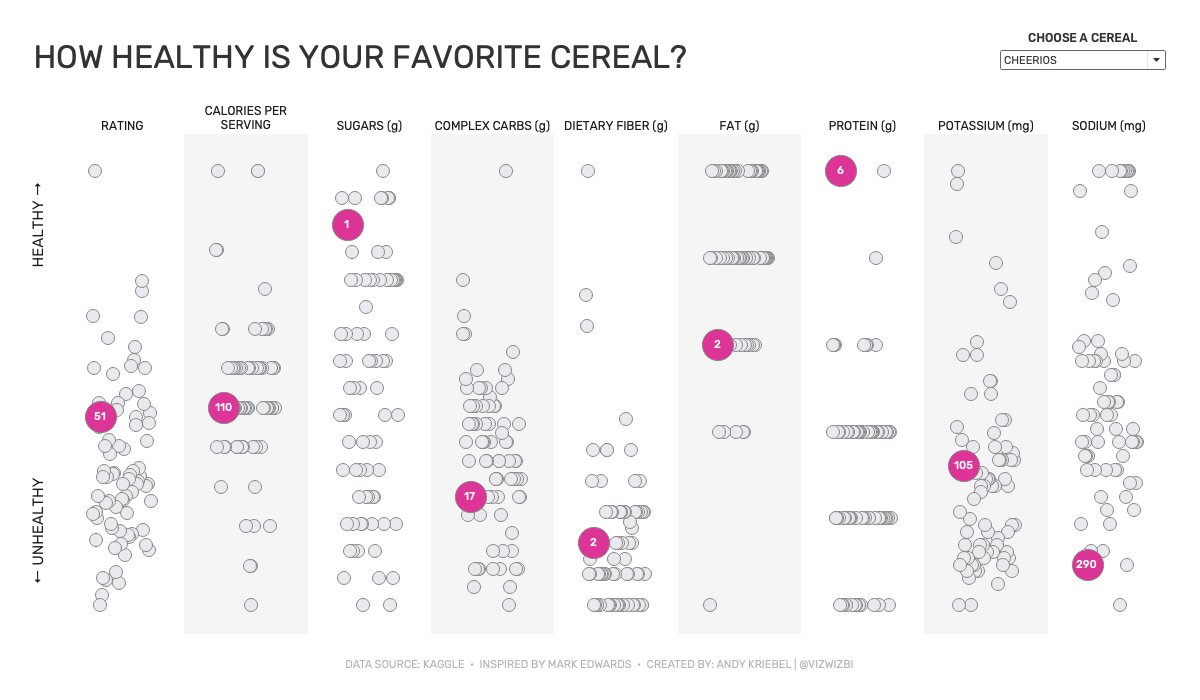
Watch Me Viz - #MakeoverMonday 2020 Week 36 - How Healthy Is Your Favorite Cereal?
September 8, 2020
#TableauTipTuesday: How to Make a Dashboard Unclickable

This week is a nice quick tip that I showed a couple years ago at TC during a Tableau Tips battle with Jeff Shaffer. There are times when you want to make sure that your users cannot click on a dashboard. This tip shows you how to make that work.
Enjoy!
September 1, 2020
#TableauTipTuesday: How to Find the Highest Selling Item per State with a Table Calculation