VizWiz

Launch, grow, and unlock your career in data

September 27, 2022

Parameter Actions: Geographical Drill Down in Tableau

No comments
Thanks for watching this video about performing a geographic drill down in Tableau!

In this video I will walk you through:
- How to drill down from Region to State
- How to get back to the State level
- How to create the parameter and parameter action

Download the workbook here.

September 26, 2022

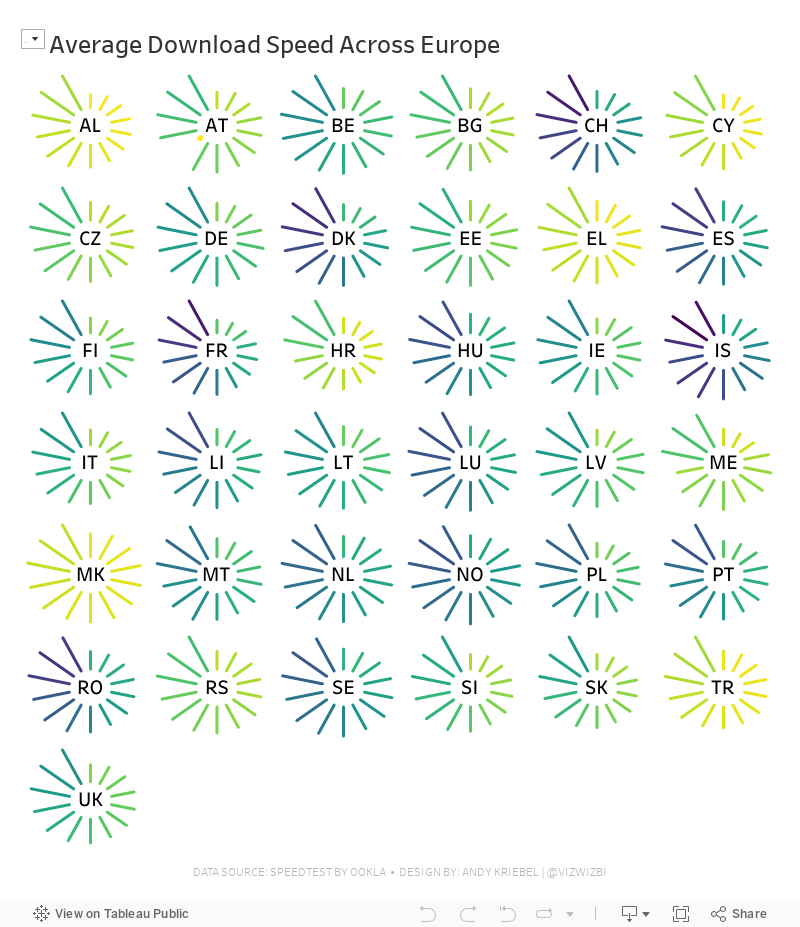
#MakeoverMonday Week 39 - Average Internet Speeds Across Europe

No comments

My goal this week was to correct my failures from last week, so I focused almost exclusively on building the starburst/sunburst chart. As promised to the viewers, I will also record a separate tip video for how to build them.

Here's the WatchMeViz and the viz is below that.


September 20, 2022

Comparing Change Between Time Periods with a Scatterplot

No comments
Displaying change in a scatterplot can be challenging. One of the simplest methods, if you only have 2 time periods (e.g., this year vs. last year), is with a connected scatterplot. These are a fantastic visualization for showing the direction of the change AND the amount of change.

September 19, 2022

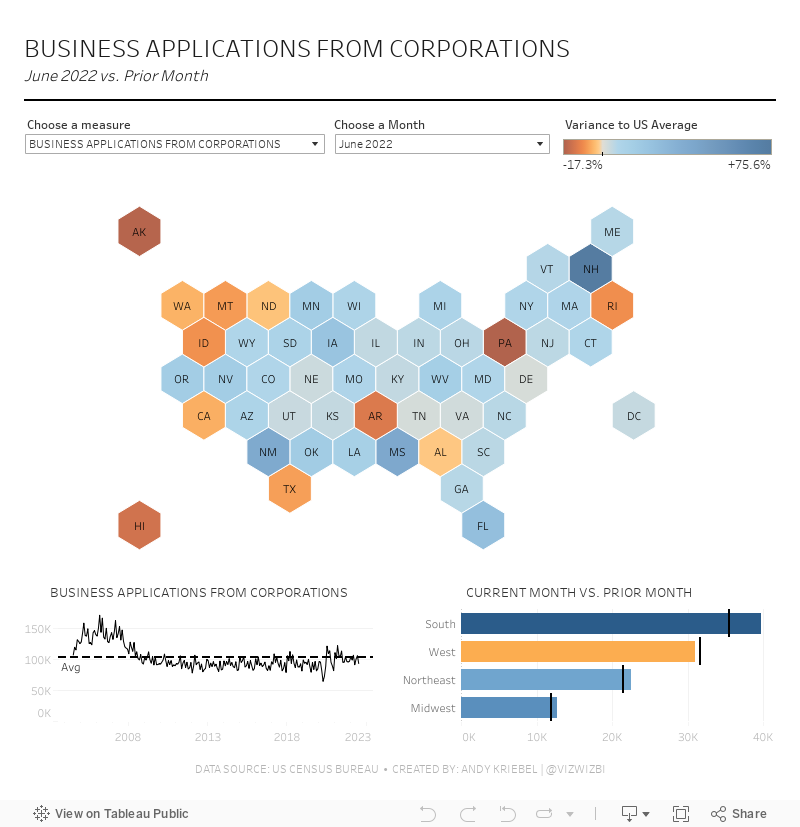
#MakeoverMonday Week 38 - American Business Applications

No comments
Well, this was a pretty epic fail. No, it was a really big fail. Those that tuned in to Watch Me Viz will be well aware of my struggles with this data set. I don't know why. Maybe it was a concentration issue. I hope it was still useful to everyone, and I hope it was good to see someone with so much experience still struggle.

My original idea was to compare each State to the US average. I got the calculations right, but it was thoroughly uninteresting. Basically, the variance rarely changed. Therefore, there was nothing to see in the analysis.

I stopped the livestream after 90 minutes, the audience and I had suffered enough. Afterwards, I took a break and came back to Tableau. This time, I thought more clearly through the solution I was trying to create. Basically, I wanted something very much like the original, just a bit better looking.

It turns out I was overcomplicating the implementation and the calculations. Parameters were a much, much better solution and allowed me the flexibility I needed to create the month over month calculations. 

I'd encourage you to check out the video. I tried lots of different things and explained what I was doing along the way, so you're sure to learn something. My final dashboard is below the video.

Have a great week everyone and thank you for being so supportive of Makeover Monday.


September 15, 2022

Table Calculations vs. Level of Detail Expressions - % of Total

No comments
In this video, I show you the difference between table calculations and level of detail expressions with the % of total calculation. I review: 

  1. How to compute a % of total with a table calc 
  2. How to compute a % of total with an LOD 
  3. How filters impact these calculations 
  4. How context filters impact level of detail expressions 
  5. Tableau's order of operations 

Download the workbook here. Download the order of operations chart here.

September 12, 2022

#MakeoverMonday 2022 Week 37 - Berkshire Hathaway Holdings

No comments

During Watch Me Viz, I covered set actions, parameter actions, highlighting, boolean calculations, table calculation, dashboard layout, and I failed at a starburst chart (I couldn't get the years to sort properly; I'll post it when I figure it out).

Enjoy! Check out the viz below the video.


September 7, 2022

The Fundamentals of Logical Functions - IF THEN vs. Case

No comments

In this video, I got through several examples of when to use an IIF, IF THEN, or CASE statement in Tableau. I also cover their best use cases, when you have to use one vs. another, and general rules of thumb.

While this is demonstrated in Tableau, it's application to nearly all tools that use logical statements.


September 5, 2022

#MakeoverMonday 2022 Week 36 - Median Age at First Marriage in America

No comments

This was a relatively simple data set and I was able to build quite a few vizzes during Watch Me Viz. I ended up with something more complex that it needed to be, but it was fun figuring out how to create the calculations.

Here's how it works:

  1. Compare the median age at first marriage of each state to the US average for 2006-2010
  2. Compare the median age at first marriage of each state to the US average for 2015-2019
  3. Check whether the State 
    1. Stayed above the US average in both time periods
    2. Stayed below the US average in both time periods
    3. Moved from below the US average to above the US average
    4. Moved from above the US average to below the US average

Got it? Yes, it a bit confusing. In the end, we were able to highlight 6 states that moved above the US average to below the US average. All others stayed the same. What does this mean from an analytical perspective? Probably nothing, but it looks better than the original.

Check out the viz below the video or here.

September 2, 2022

5 Most Common Date Functions in Tableau

No comments

In this tip, I take you through the 5 most common date functions in Tableau:

  1. DATEPART
  2. DATENAME
  3. DATETRUNC
  4. DATEADD
  5. DATEDIFF

By the end of this video you will understand when to use them to meet your use case. Click here for the cheat sheet I created for these date calculations.