September 26, 2023
Dynamic Drill-Down from Monthly to Daily Data Using Set Actions

Unlock the power of Tableau's Set Actions to enhance your data visualizations!
In this in-depth tutorial, I'll walk you through a step-by-step guide on how to create an interactive chart that allows users to drill down from monthly to daily data by simply clicking on a month.
Ideal for analysts, business intelligence professionals, and anyone who wants to level up their Tableau skills.
What You'll Learn:
- How to set up Set Actions in Tableau
- Create interactive charts for effective data exploration
- Best practices for visualizing monthly and daily data
Who This is For:
- Data Analysts
- Business Intelligence Professionals
- Tableau Beginners and Enthusiasts
Prerequisites:
- Basic understanding of Tableau Desktop
Resources:
- Download the sample workbook: https://public.tableau.com/app/profile/andy.kriebel/viz/MonthtoDayDrillDown/Sheet1
- Data: https://data.world/vizwiz/sample-soda-sales
- Tableau official documentation on Set Actions: https://help.tableau.com/current/pro/desktop/en-us/actions_sets.htm
September 19, 2023
Mastering 4-Level Map Drill Downs in Tableau

If you've enjoyed my previous tutorials on 2-level and 3-level drill downs in Tableau, prepare to take your skills to the next level.
I've got something unique for you: a step-by-step guide on creating a 4-Level Map Drill Down in Tableau!
What You'll Learn:
- How to drill down from a region to a state
- How to further drill down from a state to a county
- Finally, how to drill down from a county to a city
Prerequisites:
This is an advanced tutorial. Make sure you're comfortable with Tableau basics and have seen my 2-level and 3-level drill down videos.
Previous Videos:
2-Level Drill Down Tutorial
- https://www.vizwiz.com/2022/08/two-level-drill-down.html
- https://www.vizwiz.com/2023/06/map-drill-down.html
3-Level Drill Down Tutorial
- https://www.vizwiz.com/2023/08/dzv-drilldown.html
Links & Resources:
Workbook - https://public.tableau.com/app/profile/andy.kriebel/viz/4-LevelMapDrilldown/MapDrilldown
September 12, 2023
How to Calculate Weekday-Only Sales in Tableau

Have you ever wondered how to compare sales performance between two sets of weekdays?
In this video, I'll show you how to calculate and compare sales for the last 10 weekdays against the prior 10 weekdays—all while excluding weekends.
What You Will Learn:
- Setting up your data source for comparison
- Creating calculated fields for two sets of weekdays
- Configuring table calculations to get only the days you need
- Filtering out weekends from both data sets
- Implementing advanced date functions for comparison
- Visualizing and comparing sales for both sets of weekdays
Background Context:
Tableau enables you to conduct intricate data analyses, but comparing specific sets of weekdays can be tricky. This tutorial simplifies that process, focusing on comparing the last 10 weekdays' sales with the 10 weekdays preceding them.
Assumptions:
- You have a foundational knowledge of Tableau.
- Your sales data contains date information.
- You've previously worked with calculated fields in Tableau.
Related Videos:
Resources:
- Workbook & data: Link
#MakeoverMonday Week 37 - First time home buyers in the UK are being shut out of the market

September 5, 2023
60 Unique Ways to Visualize Time in Tableau

September 4, 2023
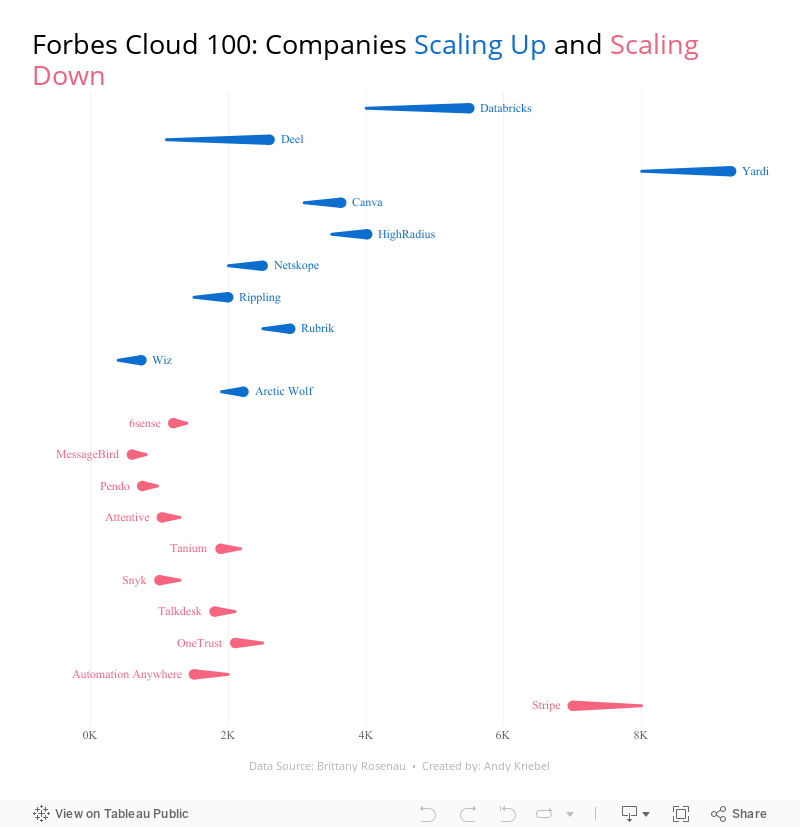
28 Charts in 60 Minutes - Forbes Cloud 100: Companies Scaling Up and Scaling Down

How many people power the Forbes Cloud 100? Is there a correlation between company rank and employee size? Have they expanded or contracted.
Learn how to build 28 charts in 60 minutes that compare two years.