September 12, 2023
How to Calculate Weekday-Only Sales in Tableau

Have you ever wondered how to compare sales performance between two sets of weekdays?
In this video, I'll show you how to calculate and compare sales for the last 10 weekdays against the prior 10 weekdays—all while excluding weekends.
What You Will Learn:
- Setting up your data source for comparison
- Creating calculated fields for two sets of weekdays
- Configuring table calculations to get only the days you need
- Filtering out weekends from both data sets
- Implementing advanced date functions for comparison
- Visualizing and comparing sales for both sets of weekdays
Background Context:
Tableau enables you to conduct intricate data analyses, but comparing specific sets of weekdays can be tricky. This tutorial simplifies that process, focusing on comparing the last 10 weekdays' sales with the 10 weekdays preceding them.
Assumptions:
- You have a foundational knowledge of Tableau.
- Your sales data contains date information.
- You've previously worked with calculated fields in Tableau.
Related Videos:
Resources:
- Workbook & data: Link
January 19, 2023
How to Calculate Day Over Day Change
In this tip, I going to show you how to build 3 different KPI cards for measuring day over day change. In just a few steps, I’ll show you how to calculate:
- Sales for the most recent day
- Sales for the previous day
- Difference in sales between those two dates
- Percent difference in sales between those two dates
I'll then show you how to create these 3 different methods for displaying the KPIs so that you can create those that are most useful for your audience.

RESOURCES
- Data - https://data.world/vizwiz/sample-car-sales
- Month over Month Change - https://www.youtube.com/watch?v=ViD3vclgNv8
- Year over Year Change - https://www.youtube.com/watch?v=YuxYr4_l2ww

November 4, 2022
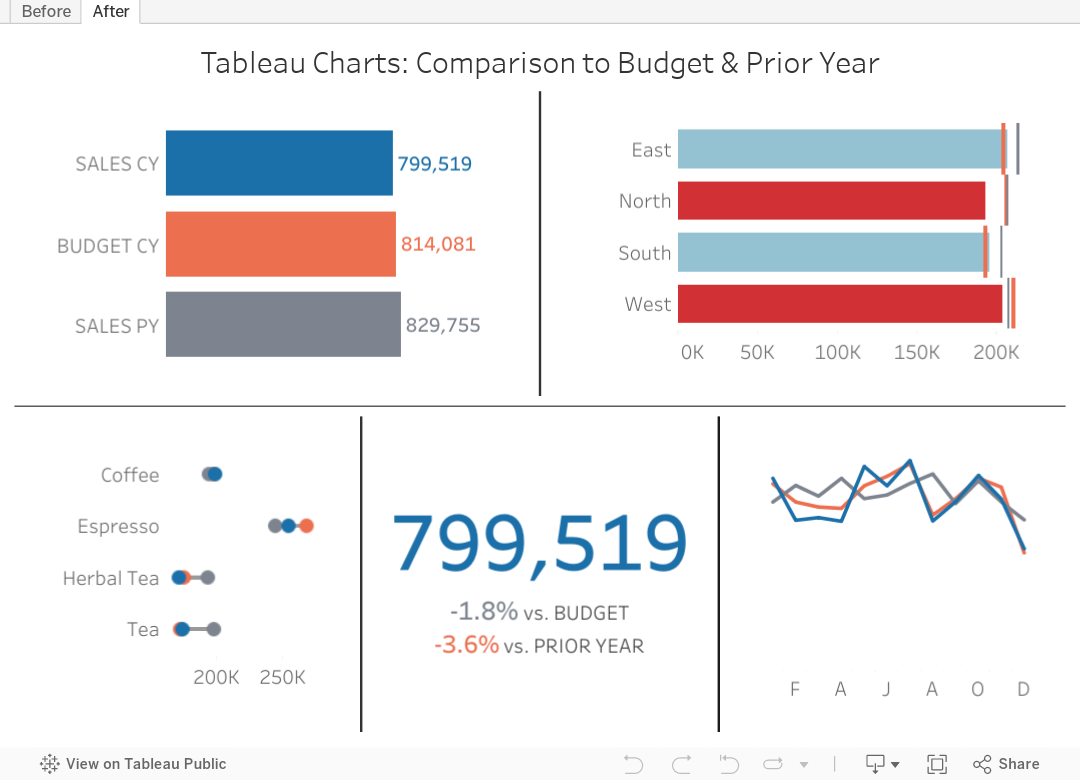
Tableau Charts: Comparison to Budget & Prior Year
Are you looking for ways to improve how you visualize comparisons between 2 to 3 performance measurements in Tableau?
In many performance monitoring dashboards, you need to make comparison of actual values to budget or target. In this video, I will show you effective ways of making these comparisons.
I will also show you how to compare your performance to prior year (PY) to see if performance is improving year over year.
One thing you'll notice in these examples is the consistent use of color. Make sure your metrics use the same colour throughout your dashboards, reports and worksheets. The colors should be easy to differentiate.
I have 4 designs that you can apply to make any comparison look better and easier to understand.
Download the workbook for a bonus 5th chart type that compares these three metrics over time.
May 19, 2021
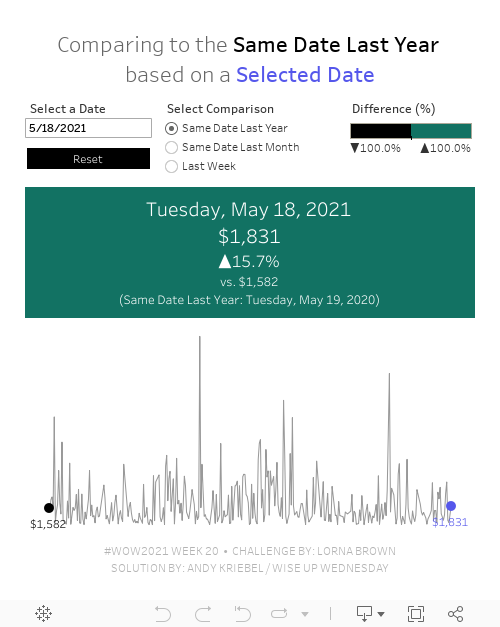
#WOW2021 Week 20: Can you compare Same Day to a Selected Date?

Wow! This workout will really test your knowledge of table calcs. The challenge comes from Lorna; view the requirements here.
The main purpose of this challenge is to get familiar with dates and parameters. Fortunately, every Wednesday I host what we call "Wise Up Wednesday" during lunch for my colleagues at The Information Lab and The Data School. We needed all of our brain power for this one. For us, the toughest part wasn't writing the calculations themselves. Rather, it was the logic required for the calculations.
From Lorna:
What if you want to compare a date you choose to the same DAY. For example, Tuesday 18th May 2021, would compare to Tuesday 19th May 2020 for the previous year, and Tuesday 20th April for the previous month. The reason you would want to do this is to compare the Tuesday to Tuesday.
This is where the logic gets tricky. We approached the solution by taking one version at a time, meaning we started by creating the calcs for the same day last year before we went onto the other two scenarios.
We got the in the end. I'd recommend building everything as a table, then change it into a chart later. It's much easier to follow what you calcs are doing.
Good luck! Here's our solution:
March 14, 2017
Tableau Tip Tuesday: Using LODs to View the Latest, Previous and Prior Months

I'm using LOD expressions in this video along with the DATEDIFF and DATETRUNC functions. Below this video, you will see the calculations that I used if you want to copy/paste them for your own use.

Latest Month Sales
IF DATEDIFF('month',DATETRUNC('month',[Order Date]),{MAX(DATETRUNC('month',[Order Date]))})=0THEN [Sales]
END
Previous Month Sales
IF DATEDIFF('month',DATETRUNC('month',[Order Date]),{MAX(DATETRUNC('month',[Order Date]))})=1THEN [Sales]
END
Prior Month Sales
IF DATEDIFF('month',DATETRUNC('month',[Order Date]),{MAX(DATETRUNC('month',[Order Date]))})=2THEN [Sales]
END
If you want the months to be labeled…
Latest 3 Months
DATEDIFF('month',DATETRUNC('month',[Order Date]),
{MAX(DATETRUNC('month',[Order Date]))}) <= 2
Latest N Months
DATEDIFF('month',DATETRUNC('month',[Order Date]),
{MAX(DATETRUNC('month',[Order Date]))}) < [How many months?]






