January 19, 2023
How to Calculate Day Over Day Change
In this tip, I going to show you how to build 3 different KPI cards for measuring day over day change. In just a few steps, I’ll show you how to calculate:
- Sales for the most recent day
- Sales for the previous day
- Difference in sales between those two dates
- Percent difference in sales between those two dates
I'll then show you how to create these 3 different methods for displaying the KPIs so that you can create those that are most useful for your audience.

RESOURCES
- Data - https://data.world/vizwiz/sample-car-sales
- Month over Month Change - https://www.youtube.com/watch?v=ViD3vclgNv8
- Year over Year Change - https://www.youtube.com/watch?v=YuxYr4_l2ww

August 24, 2021
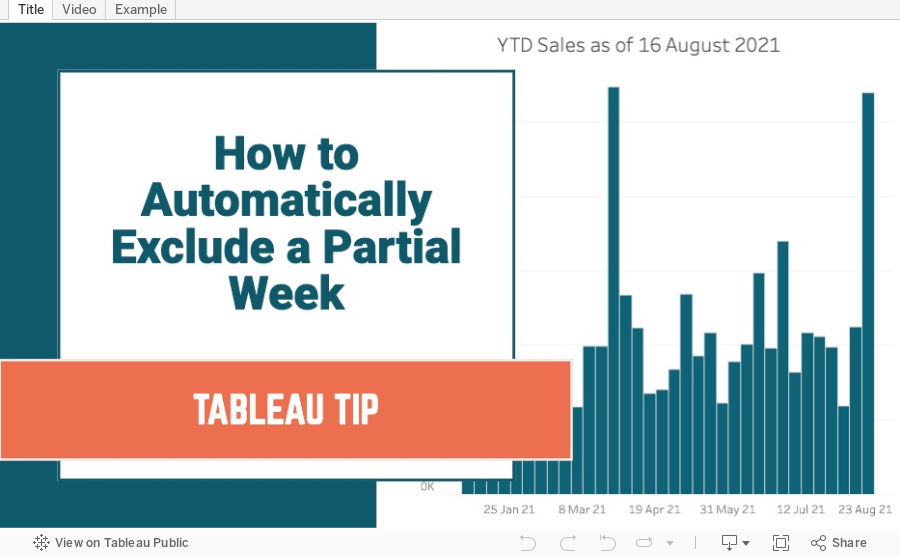
How to Automatically Exclude a Partial Week
July 21, 2021
How to Compare to the Prior N Months Using the IN Function

January 15, 2019
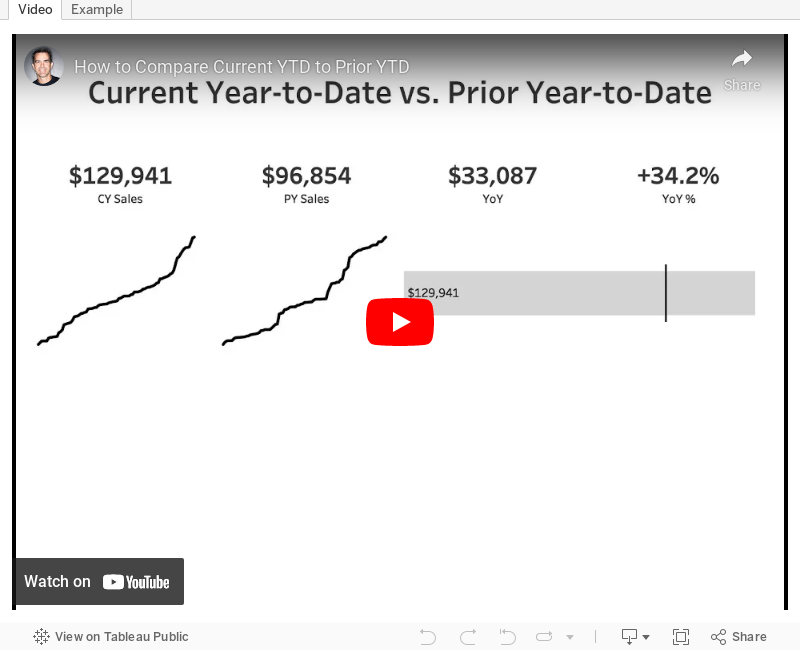
Tableau Tip Tuesday: How to Compare Current YTD to Prior YTD

How would you do year to date percent difference when you only have data for first 3 months in the current year? For example when you have data for the current year from January to March for 2018 and you want to compare it to January to March from 2017 and calculate percent difference then?
This is a very common business question. In this video I show you how to use level of detail expressions to calculate these two fields plus the difference.
NOTE: In the video, I have the Year over Year calculation backwards. The formula should be: SUM([CY Sales])-SUM([PY Sales])
May 9, 2017
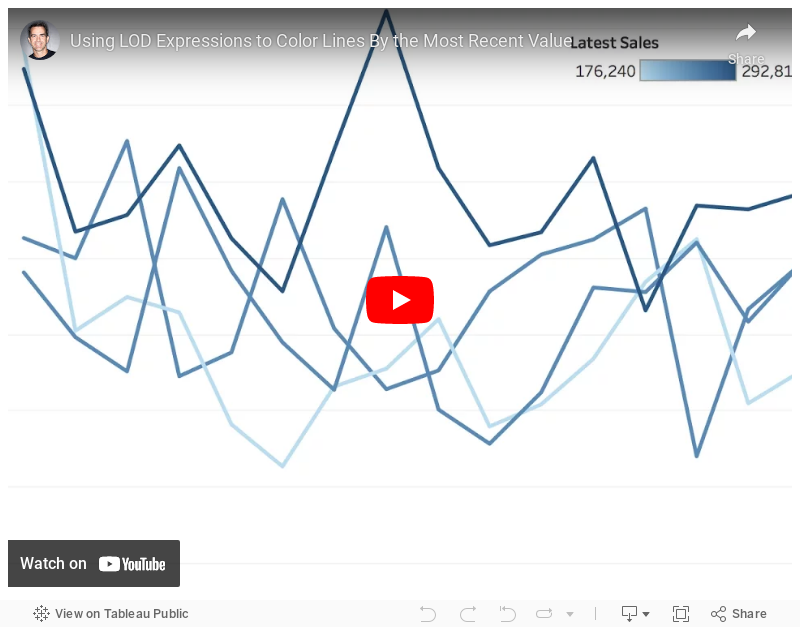
Tableau Tip Tuesday: Using LOD Expressions to Color Lines By the Most Recent Value
How can I color each line on a line chart by the most recent value?This requires a three-pass LOD expression. The key is to realize that Tableau created an aggregate table for each LOD working from the inside out. So
- Tableau calculates the inside LOD first.
- Then the second LOD is calculated based on the results of the first LOD.
- Then the third LOD is calculated based on the results of the second LOD.
Make sense? I hope so! If not, let me know. Enjoy!
March 14, 2017
Tableau Tip Tuesday: Using LODs to View the Latest, Previous and Prior Months

I'm using LOD expressions in this video along with the DATEDIFF and DATETRUNC functions. Below this video, you will see the calculations that I used if you want to copy/paste them for your own use.

Latest Month Sales
IF DATEDIFF('month',DATETRUNC('month',[Order Date]),{MAX(DATETRUNC('month',[Order Date]))})=0THEN [Sales]
END
Previous Month Sales
IF DATEDIFF('month',DATETRUNC('month',[Order Date]),{MAX(DATETRUNC('month',[Order Date]))})=1THEN [Sales]
END
Prior Month Sales
IF DATEDIFF('month',DATETRUNC('month',[Order Date]),{MAX(DATETRUNC('month',[Order Date]))})=2THEN [Sales]
END
If you want the months to be labeled…
Latest 3 Months
DATEDIFF('month',DATETRUNC('month',[Order Date]),
{MAX(DATETRUNC('month',[Order Date]))}) <= 2
Latest N Months
DATEDIFF('month',DATETRUNC('month',[Order Date]),
{MAX(DATETRUNC('month',[Order Date]))}) < [How many months?]
April 19, 2016
Tableau Tip Tuesday: Using LOD Calcs to Filter the Latest Month and View Sales for the Latest Day

I’ve written before about making the ends of sparklines actionable here and here and created a video here. Each of these uses table calcs to add the dot on the end of the lines. The problem, though, is the method falls apart when the end date on all of the lines isn’t the same. Yes, there are other workarounds with table calcs, but they are overly complicated.
I’ve been wanted to look at this again with level of detail expressions, thinking there had to be a simpler way to create and maintain them, and a way to overcome the drawback listed above. The video below walks through two level of detail expression:
- Create a filter using a LOD calc to dynamically return just the latest month in the data set
- Return the value of the end of EACH line of a series of sparklines
This technique could easily be parameterized, but for this example, I stick to a single dimension. Enjoy!






