Workout Wednesday
What is Workout Wednesday?
Do you think you're good with Tableau? Are you looking for an additional challenge? Workout Wednesday might be what you need. Workout Wednesday a set of weekly challenges from Andy Kriebel and Emma Whyte (for 2017) and Rody Zakovich (for 2018) designed to test your knowledge of Tableau and help you kick on in your development. We will alternate weekly challenges:- For 2017, Andy will take the odd weeks and post them on his blog.
- For 2017, Emma post challenges on the even weeks on her blog.
- Links to all of the 2017 challenges can be found on this page.
- For 2018, Rody Zakovich will be taking over and partnering with Luke Stanke.
- Find all of the 2018 Challenges here.
The idea is to replicate the challenge that we pose as closely as possible. When you think you have it, leave a comment with a link to your visualisation and post a pic on Twitter for others to enjoy.
Week 53
Looks vs. Personality
Week 52
UK's Favorite Christmas Chocolates
Week 51
State by State Profit Ratio
Week 50
Rocket Ship Chart
Week 49
Position of Letter Occurrences in Baby Names
Week 48
Treemap Drilldown
Week 47
Fun with Formatting
Week 46
Top N Customers
Week 45
Stock Portfolio
Week 44
Customer Cohorts
Week 43
The Seasonality of Superstore
Week 42
Market Basket Analysis
Week 41
State to City Drill Down
Week 40
All Sorts | Part 2
Week 39
Are the contributions of top sellers increasing throughout the year?
Week 38
(It Takes) All Sorts
Week 37
Killings of Blacks by Whites Are Far More Likely to Be Ruled 'Justifiable'
Week 36
Which UK Airport Should You Fly From?
Week 35
Average Latitude of Solar Eclipses by Century
Week 34
Disney's Domination
Week 33
How Have Home Prices Changed?
Week 32
Continous Dates Are Tricky
Week 31
The Timing of Baby Making
Week 30
Loads of LODs
Week 29
Who sits where at the Data School?
Week 28
Insights & Annotations
Week 27
The Quadrant Chart
Week 26
UK General Election 2017 Results
Week 25
Visualising the National Student Survey with Spine Charts
Week 24
Visualising the National Student Survey with Spine Charts
Week 23
National Parks Have Never Been More Popular
Week 22
Wine Tasting Is Harder Than It Looks
Week 21
NCAA Final Score-by-Score
Week 20
Comparing Regions
Week 19
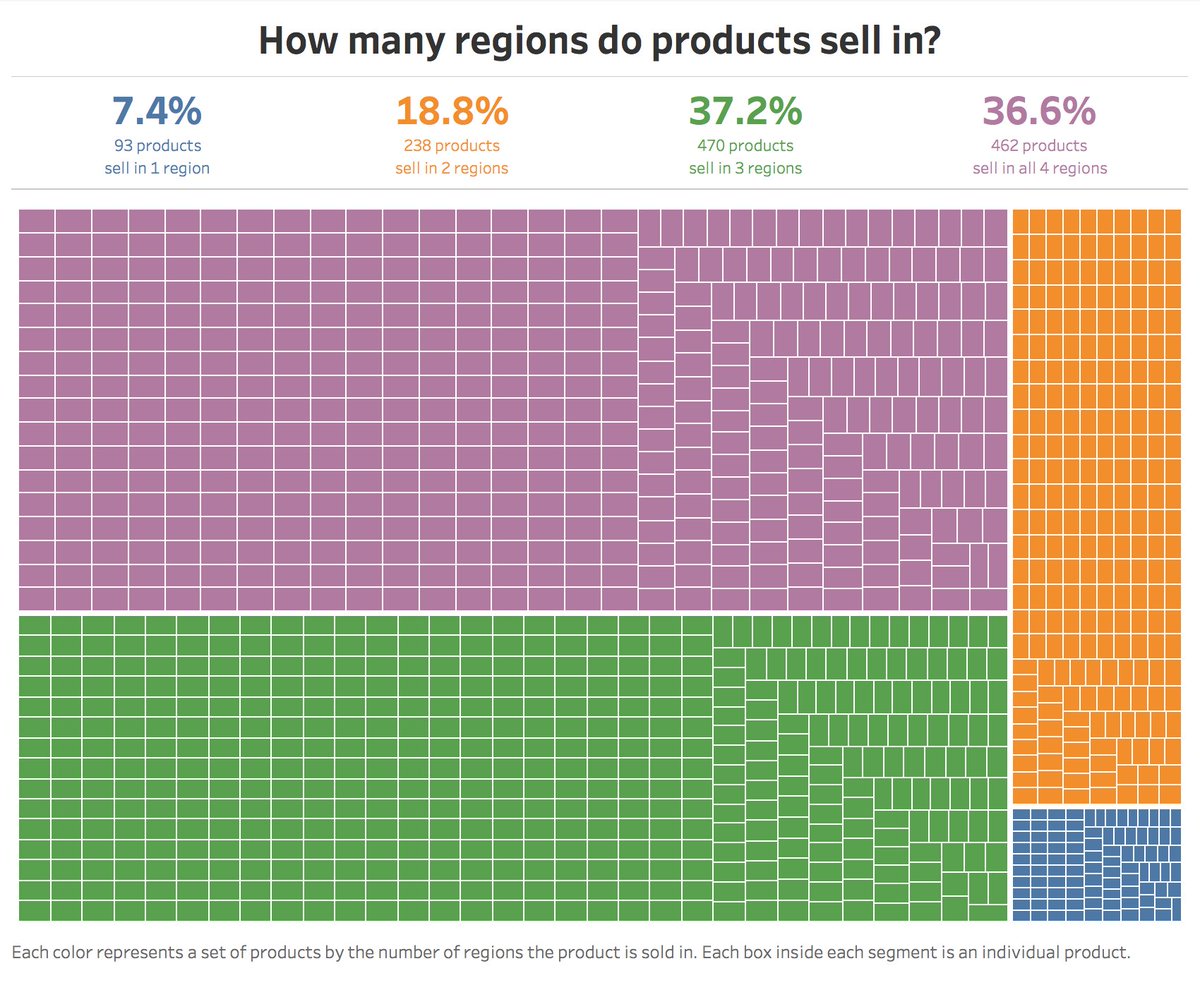
Product Spread Treemap (Part 2)
Week 18
Appearing and Disappearing Vizzes
Week 17
Product Spread Treemap (Part 1)
Week 16
Should I Buy Tableau Shares?
Week 15
How many times has a team been top of the Premier League?
Week 14
UK Exports Pareto
Week 13
Benford's Law
Week 12
Highlight a Treemap
Week 11
Full Year Calendar with Month Labels
Week 10
Exploring UK House Prices
Week 9
World Series Game 7: Pitch-By-Pitch
Week 8
Merimekko Makeover
Week 7
Dynamic Trellis Chart
Week 6
UK Population Predictions - Trellis Butterfly Chart
Week 5
The Distribution and Mean of NFL Quarterbacks
Week 4
Common Baseline Charts & NFL QBs
Week 3
The State of U.S. Jobs
Week 2
Showing Nothing When 'All' is Selected
Week 1
Comparing Year over Year Purchase Frequencies
Subscribe to:
Comments
(
Atom
)


