May 24, 2017
Workout Wednesday: NCAA Final Score-by-Score
basketball
,
cumulative
,
Gonzaga
,
NCAA
,
North Carolina
,
sports
,
table calc
,
tarheels
,
UNC
,
Workout Wednesday
2 comments
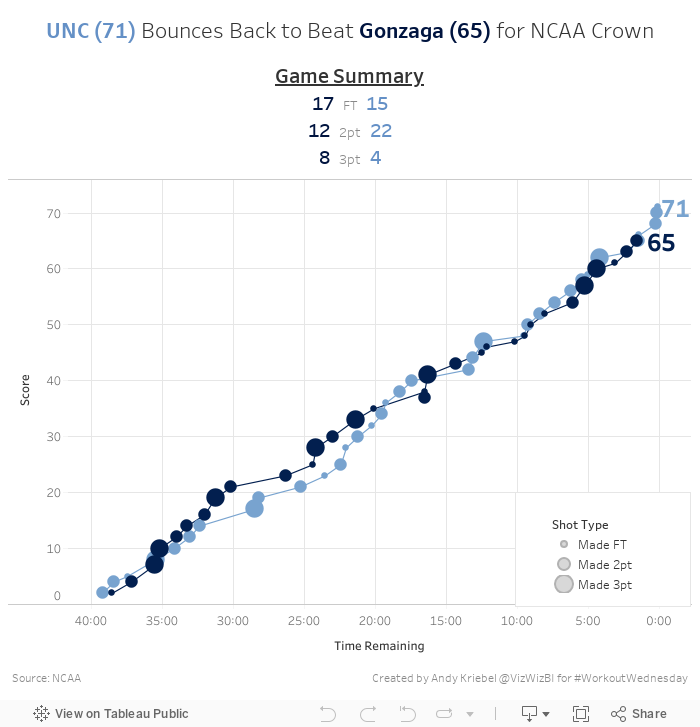
Here's your challenge:
- Final dashboard is 700x700
- Everything must be a single sheet except for the footer
- Match the title, summary below the title, colors, and tooltips
- Each circle represents a score
- Circles are sized by the type of basket (FT, 2Pt, 3pt)
- Score must be cumulative across the game; note that time counts down in basketball
- Tooltips should shows the score at that moment in time and a description of what happened
- UNC color is #6490C6 while the Gonzaga color is #00143F
- Gridlines should be displayed every 5 minutes and every 10 points
- Last basket for each team should be labeled with the cumulative score
Download the data here. I think that's it, but if I missed a requirement, let me know and I'll update this post. Good luck!
Subscribe to:
Post Comments
(
Atom
)


Hi Andy, how did you force the original 'Time' field in the Excel data file to be text? When I connected Tableau to the Excel file, it automatically reads it in HH:MM:SS format and some rows have the exact same measure value. Thanks!
ReplyDeleteDownload my workbook and see how I did I it.
Delete