October 31, 2023
How to Create a Year→Quarter→Month→Day Drilldown in Tableau

Are you looking to take your Tableau skills to the next level? Do you want to create dashboards that offer a dynamic and interactive experience?
Look no further!
This comprehensive tutorial will walk you through the process of creating a Year→Quarter→Month→Day Drilldown in Tableau.
🔹 What You'll Learn:
1. How to set up 2 parameters for drilldown functionality
2. How to perform 9 simple calculations that power your dashboard
3. How to implement 8 simple dashboard actions for enhanced interactivity
4. Introduction to dynamic zone visibility
🔹 Who Should Watch:
1. Data analysts looking to expand their Tableau toolkit
2. Business intelligence professionals aiming for dynamic reporting
3. Anyone who wants to unlock the full potential of Tableau
🔹 Why This Tutorial is Unique:
1. Step-by-step guide for each component: Parameters, Calculations, and Dashboard Actions
2. Introduction to advanced Tableau functionalities like dynamic zone visibility
3. Reusable examples to cement your understanding
4. Tips and tricks for maximizing the utility of your drilldowns
Don't miss out on upgrading your Tableau skills.
Let's dive into the world of advanced Tableau functionalities and take your dashboards to the next level!
October 24, 2023
Master Containers: Build an Interactive Tableau Dashboard From Scratch

October 17, 2023
Enhancing Tableau Drill-Downs: Use LODs in Hierarchies

Have you ever felt your drill-downs could be more insightful? Dive into this tutorial to see the magic of LOD expressions within hierarchies.
This will help us unlock deeper insights and makes data exploration even more insightful.
Whether you're well-versed in Tableau or just looking to level up your skills, there's something here for everyone.
Get the workbook - Link
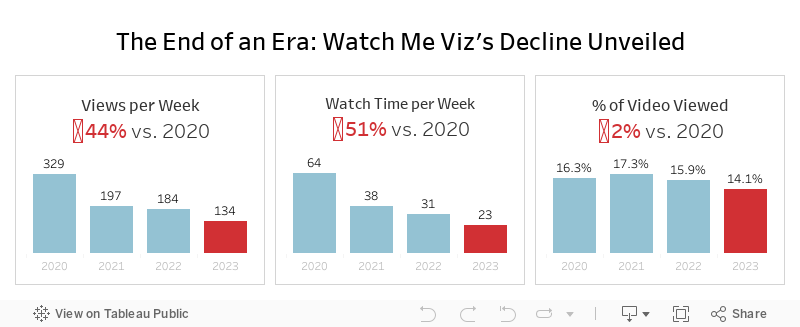
The End of an Era: Watch Me Viz's Decline Unveiled

That's a wrap. Watch Me Viz has retired, for good.
This week's data was about the performance of all of the WMV livestreams. There was some incredible viewer participation, which ultimately led to this viz that explains why WMV should quietly disappear.
Check out the livestream below.
October 10, 2023
Fix Your Broken Worksheet Actions in Tableau Dashboards

Ever wonder why your worksheet actions don't seem to play nicely when incorporated into a Tableau dashboard? You're not alone!
Everyone that starts using Tableau faces this hiccup, often leading to unnecessary hours of troubleshooting.
The answer is simpler than you think: change the worksheet action to a dashboard action!
In this tutorial, I'll walk you through this straightforward switch, step-by-step.
This will save you loads of time and frustration.
October 9, 2023
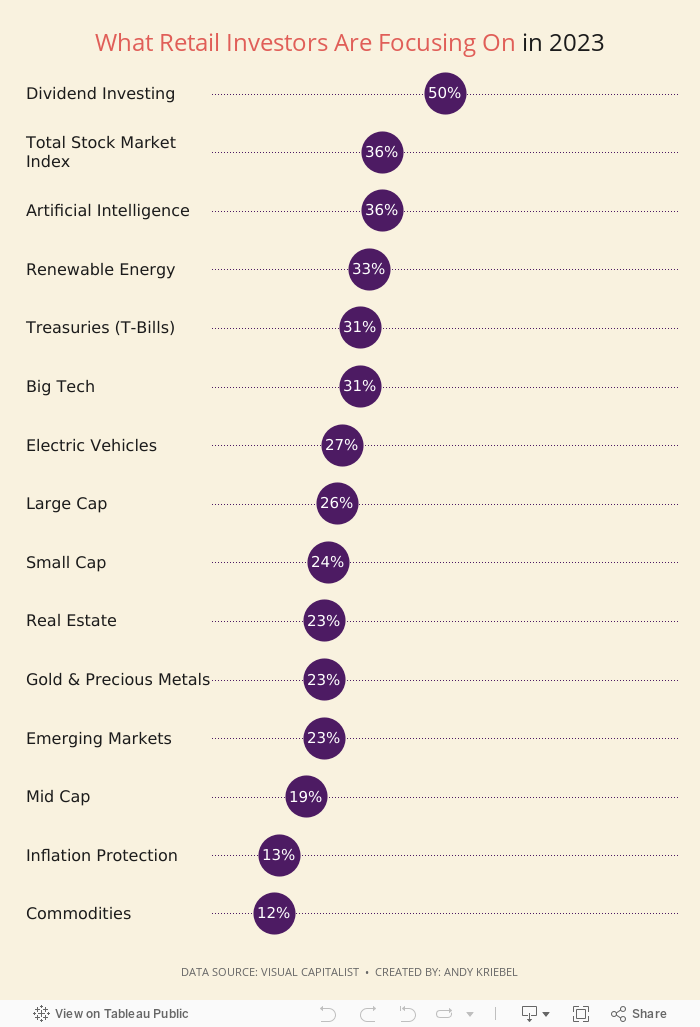
Behind the Chart Redesign: Retail Investment Step-by-Step Makeover

Catch up on my latest #MakeoverMonday Watch Me Viz. I dive into a step-by-step redesign of Visual Capitalists "What are Retail Investors Interested in Buying in 2023?" chart.
Starting with an overview of the original visualization, I review the gaps and areas for improvement. Why was a makeover necessary, and what potential did we see?
The livestream walks you through the entire transformation process, from the initial critique to the final touches.
Expect to uncover advanced design techniques and gain insights into the strategic thought process behind each decision.
Whether you're an aspiring designer or a seasoned data analyst, this step-by-step makeover promises valuable takeaways for all.
October 3, 2023
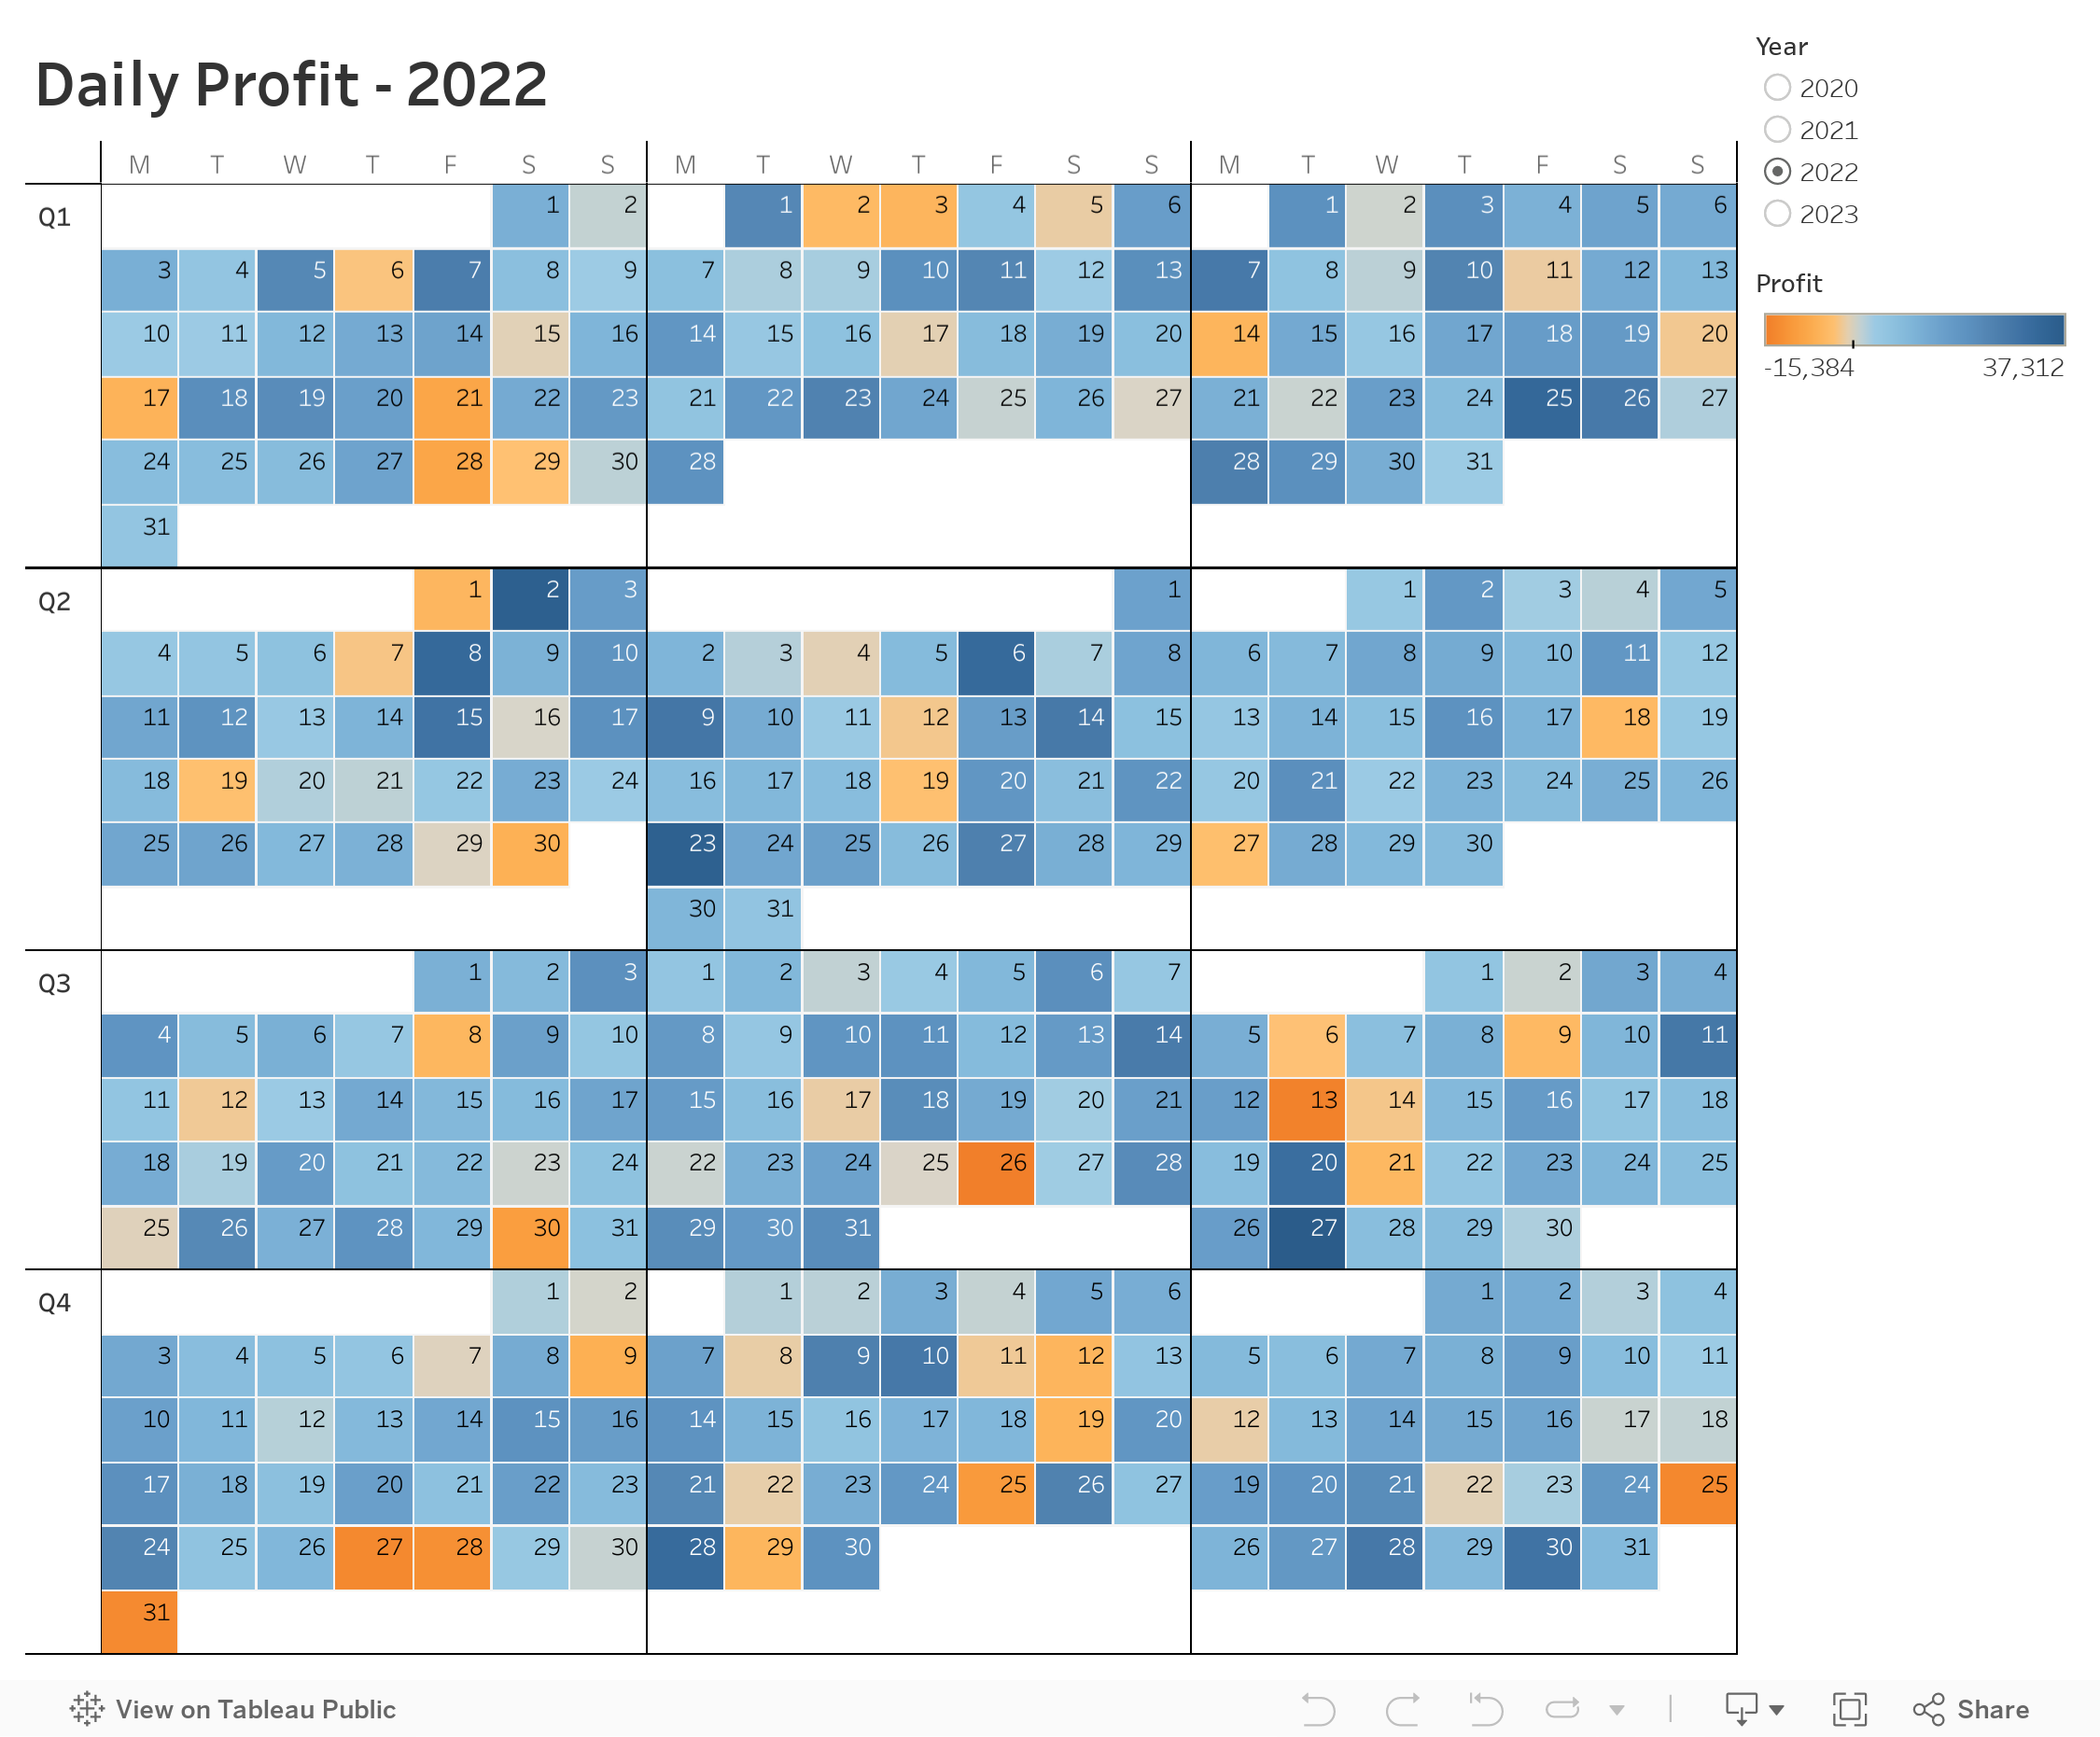
Master Dynamic Zone Visibility in Tableau: Yearly to Monthly Calendar Drill Down

Welcome to this comprehensive tutorial on creating a Yearly to Monthly Calendar Drill Down using Dynamic Zone Visibility in Tableau.
📌 What You Will Learn
In this video, you'll discover how to use Tableau's Dynamic Zone Visibility feature to effortlessly switch between yearly and monthly calendar views. If you've been looking to add more flexibility and dynamism to your Tableau dashboards, this tutorial is designed for you.🔑 Key Takeaways
- Understand the concept of Dynamic Zone Visibility- Set up a yearly calendar view in Tableau
- Implement drill-down functionalities to transition to a monthly calendar view
- Practical tips and tricks for optimizing your Tableau dashboards
🔗 Additional Resources
- Data- Workbook