Showing posts with label year. Show all posts
October 3, 2023
Master Dynamic Zone Visibility in Tableau: Yearly to Monthly Calendar Drill Down
boolean
,
calendar
,
calendar drill down
,
data visualization
,
drill down
,
drilldown
,
dynamic zone visibility
,
how to
,
interactivity
,
month
,
parameter
,
parameter action
,
tableau
,
tip
,
tutorial
,
year
No comments

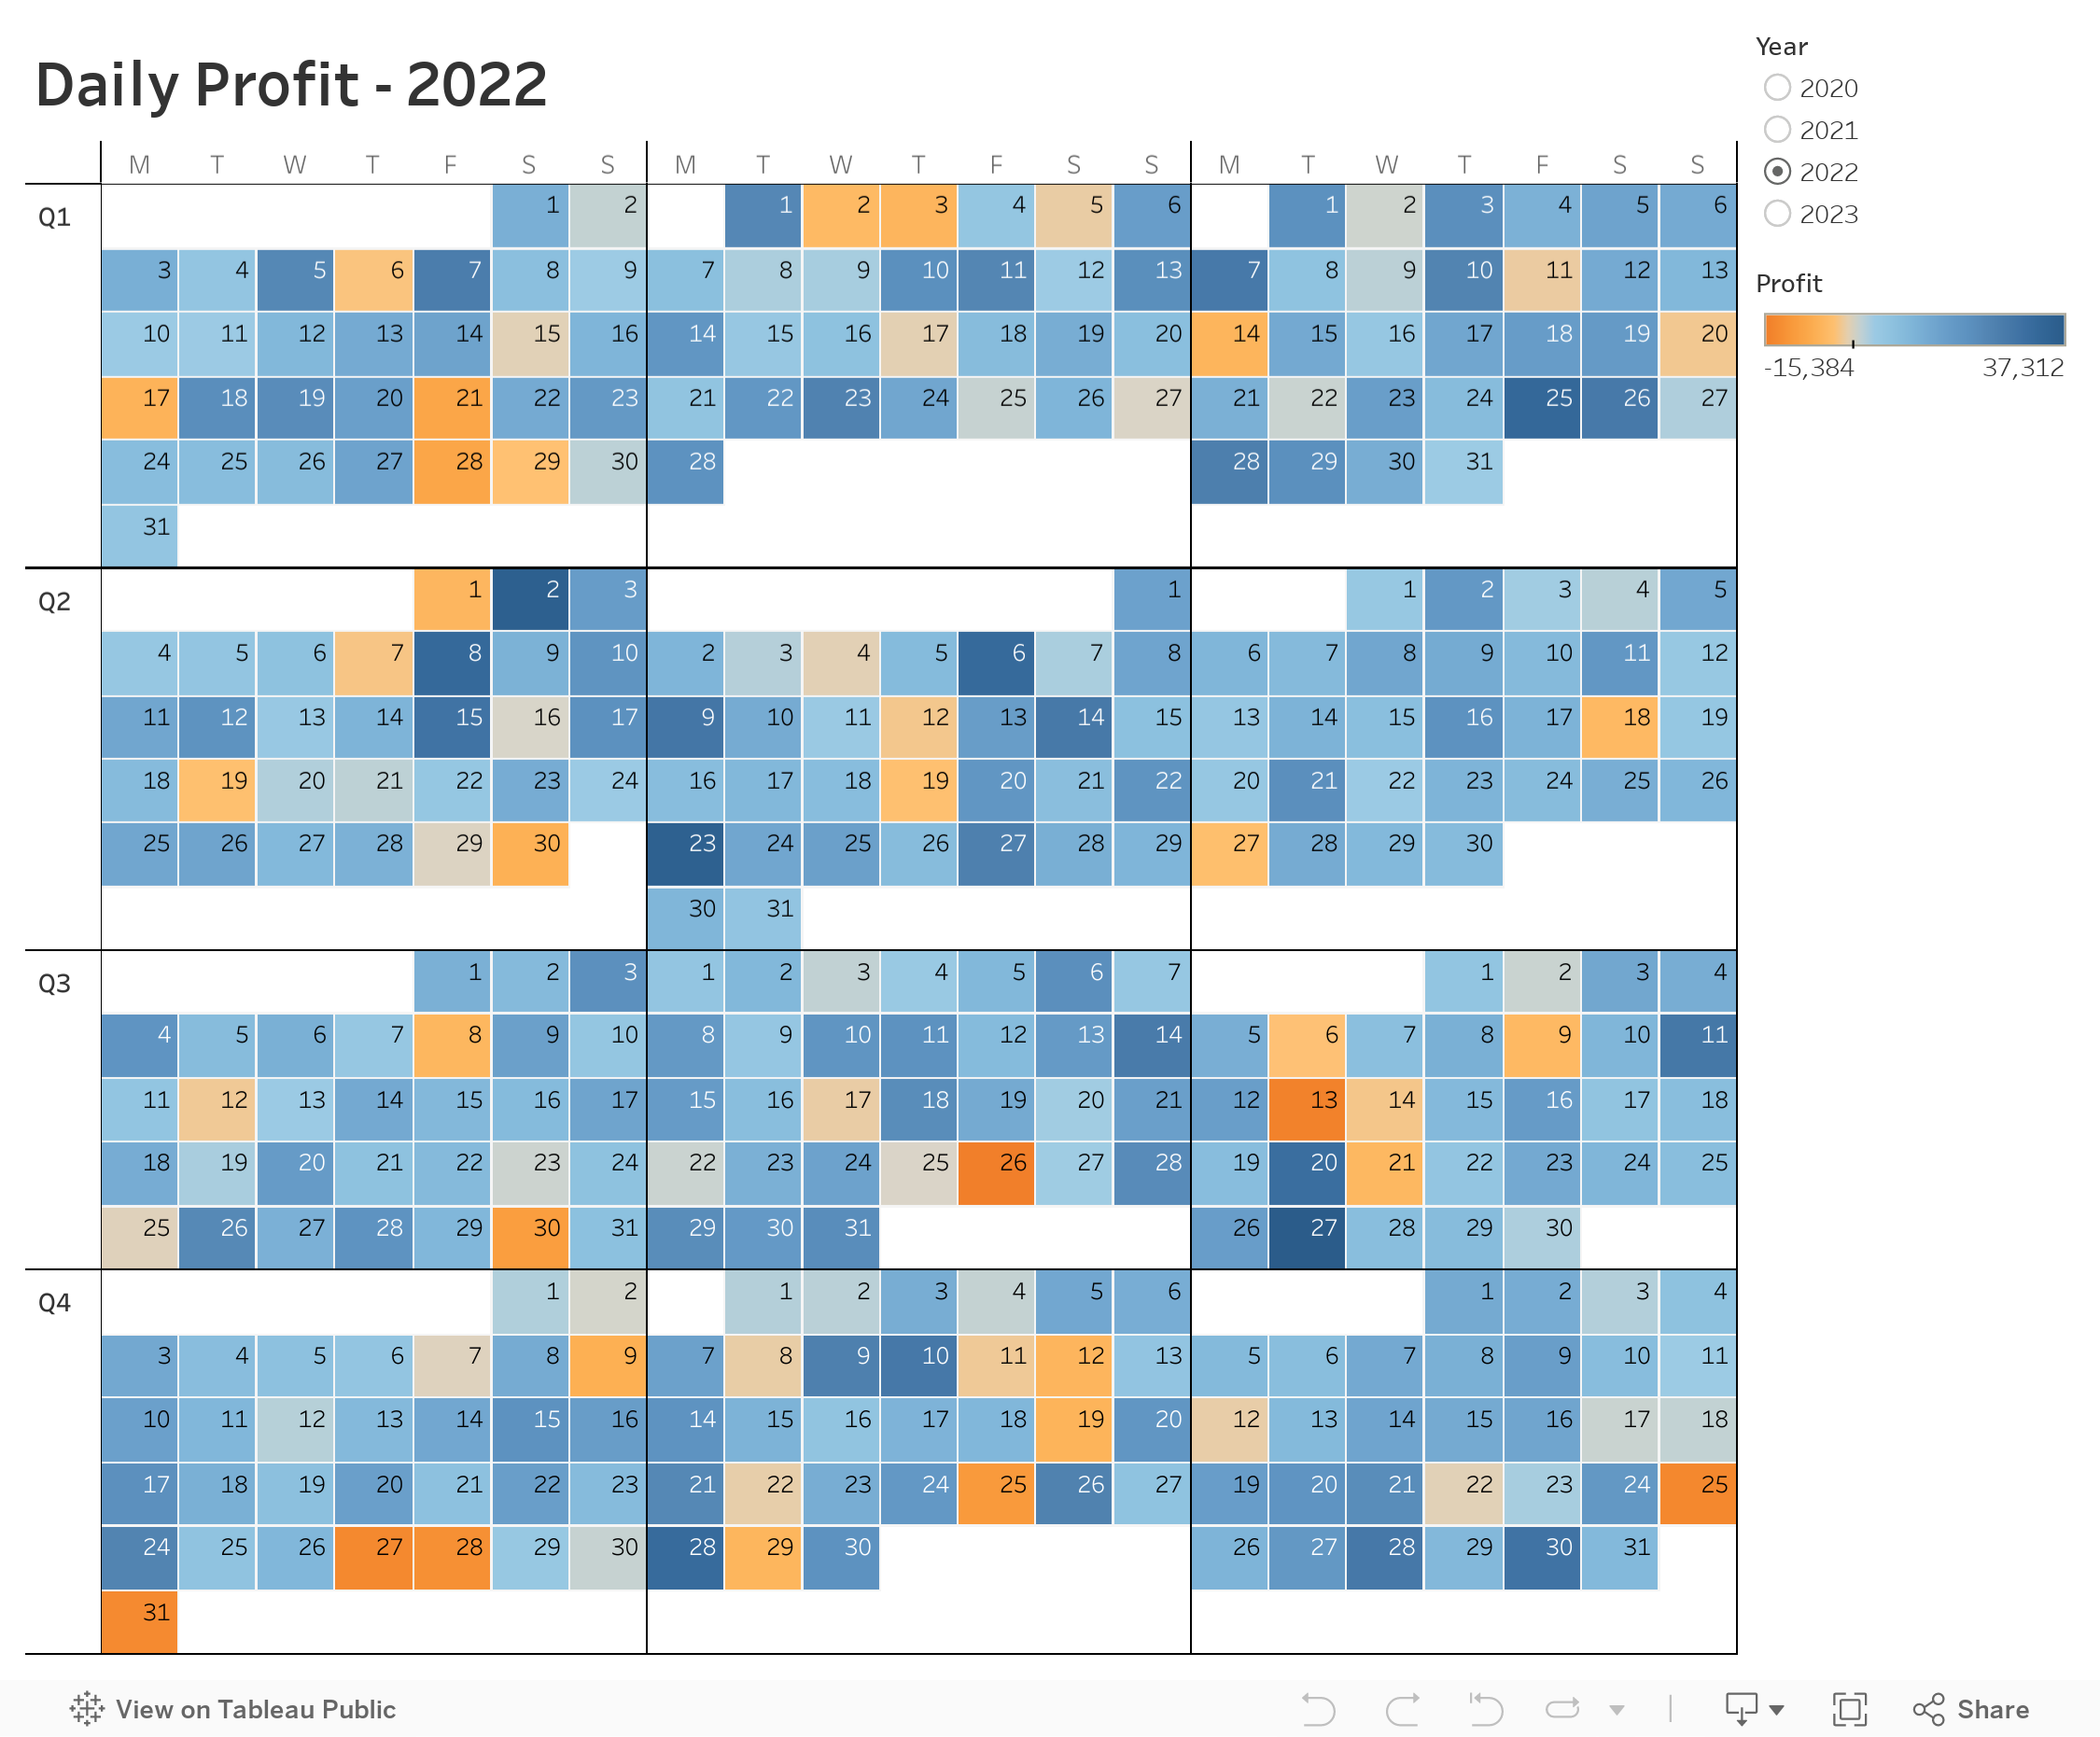
Welcome to this comprehensive tutorial on creating a Yearly to Monthly Calendar Drill Down using Dynamic Zone Visibility in Tableau.
📌 What You Will Learn
In this video, you'll discover how to use Tableau's Dynamic Zone Visibility feature to effortlessly switch between yearly and monthly calendar views. If you've been looking to add more flexibility and dynamism to your Tableau dashboards, this tutorial is designed for you.🔑 Key Takeaways
- Understand the concept of Dynamic Zone Visibility- Set up a yearly calendar view in Tableau
- Implement drill-down functionalities to transition to a monthly calendar view
- Practical tips and tricks for optimizing your Tableau dashboards
🔗 Additional Resources
- Data- Workbook
April 12, 2022
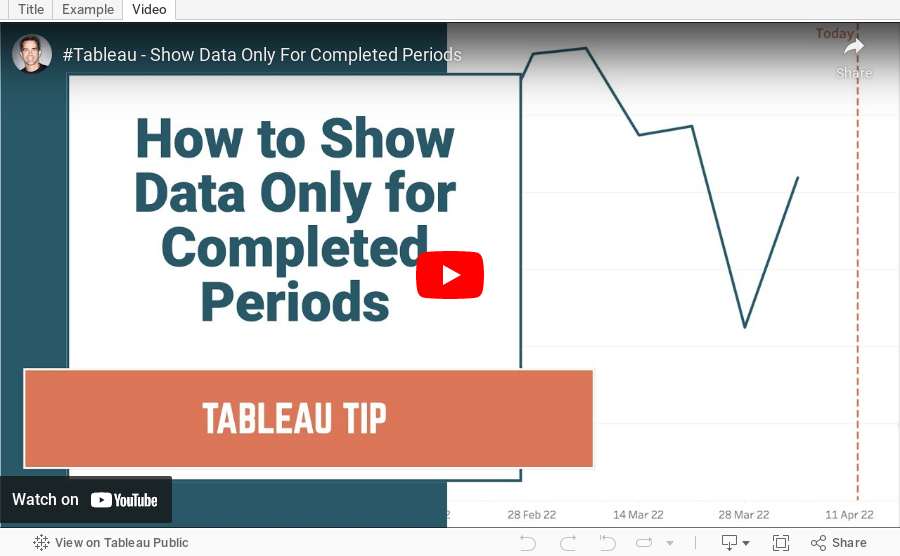
How to Show Data for Only Completed Periods
boolean
,
calculated field
,
chart
,
comparison
,
complete
,
context
,
date
,
filter
,
graph
,
how to
,
line chart
,
month
,
quarter
,
tableau
,
tip
,
tutorial
,
week
,
year
No comments
June 7, 2021
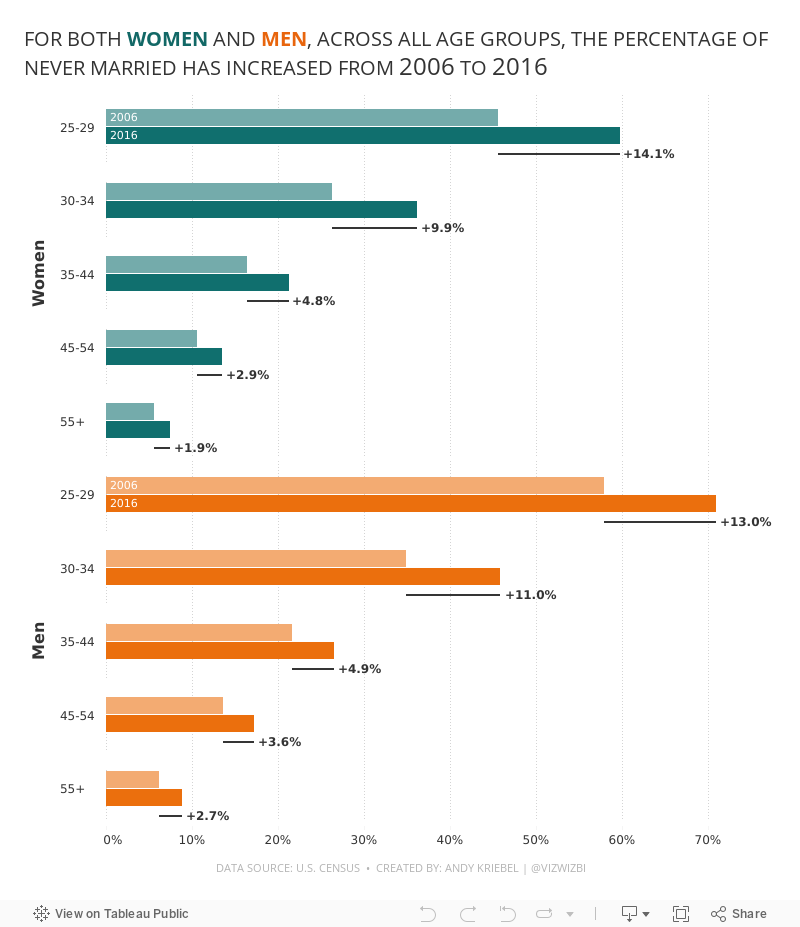
#MakeoverMonday 2021 Week 23: The Percentage of Never Married is on the Rise
age
,
bar chart
,
bar in bar
,
butterfly chart
,
candlestick chart
,
charts
,
dumbbell
,
gender
,
graphs
,
Makeover Monday
,
marriage
,
population pyramid
,
slope graph
,
time
,
tip
,
tutorial
,
WatchMeViz
,
year
No comments

Resources:
- Final Viz (and below)
- Preferences file (all of my custom color palettes)
- How to Create a Combination Bar Chart & Candlestick Chart
Subscribe to:
Posts
(
Atom
)






