October 31, 2023
How to Create a Year→Quarter→Month→Day Drilldown in Tableau

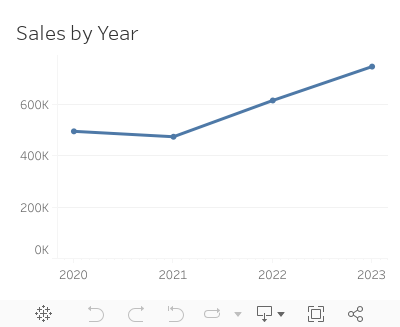
Are you looking to take your Tableau skills to the next level? Do you want to create dashboards that offer a dynamic and interactive experience?
Look no further!
This comprehensive tutorial will walk you through the process of creating a Year→Quarter→Month→Day Drilldown in Tableau.
🔹 What You'll Learn:
1. How to set up 2 parameters for drilldown functionality
2. How to perform 9 simple calculations that power your dashboard
3. How to implement 8 simple dashboard actions for enhanced interactivity
4. Introduction to dynamic zone visibility
🔹 Who Should Watch:
1. Data analysts looking to expand their Tableau toolkit
2. Business intelligence professionals aiming for dynamic reporting
3. Anyone who wants to unlock the full potential of Tableau
🔹 Why This Tutorial is Unique:
1. Step-by-step guide for each component: Parameters, Calculations, and Dashboard Actions
2. Introduction to advanced Tableau functionalities like dynamic zone visibility
3. Reusable examples to cement your understanding
4. Tips and tricks for maximizing the utility of your drilldowns
Don't miss out on upgrading your Tableau skills.
Let's dive into the world of advanced Tableau functionalities and take your dashboards to the next level!
October 3, 2023
Master Dynamic Zone Visibility in Tableau: Yearly to Monthly Calendar Drill Down

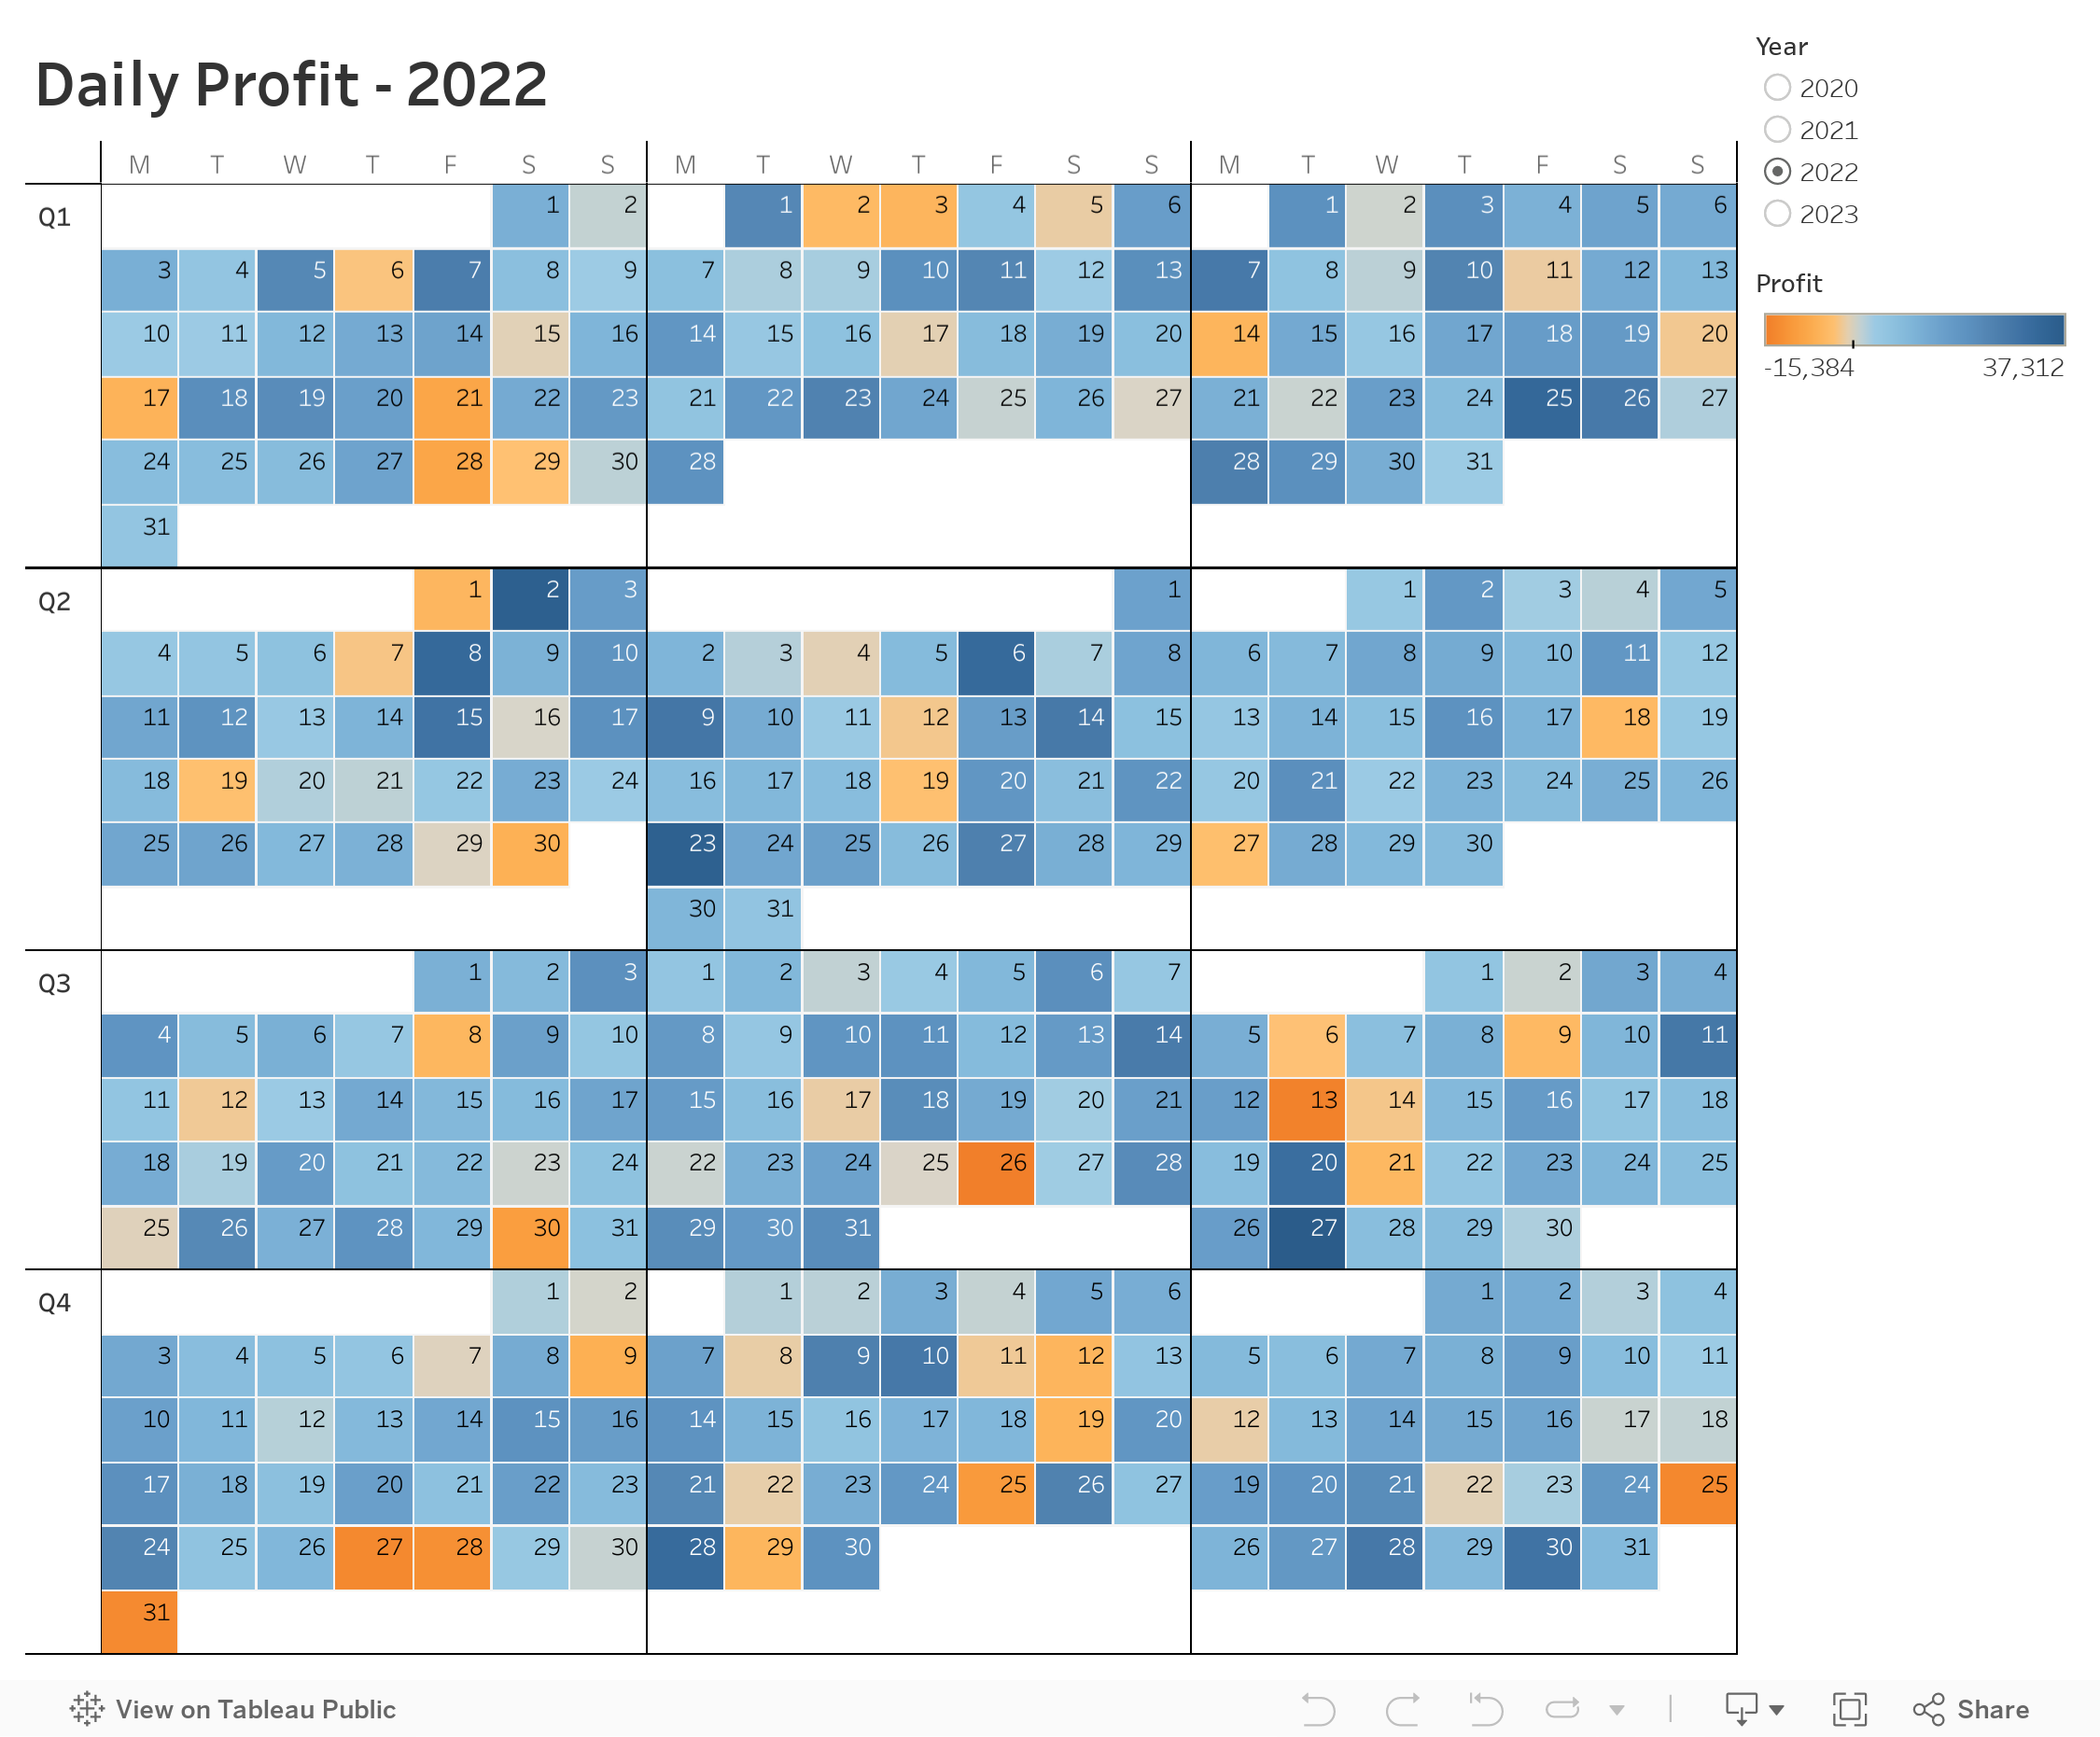
Welcome to this comprehensive tutorial on creating a Yearly to Monthly Calendar Drill Down using Dynamic Zone Visibility in Tableau.
📌 What You Will Learn
In this video, you'll discover how to use Tableau's Dynamic Zone Visibility feature to effortlessly switch between yearly and monthly calendar views. If you've been looking to add more flexibility and dynamism to your Tableau dashboards, this tutorial is designed for you.🔑 Key Takeaways
- Understand the concept of Dynamic Zone Visibility- Set up a yearly calendar view in Tableau
- Implement drill-down functionalities to transition to a monthly calendar view
- Practical tips and tricks for optimizing your Tableau dashboards
🔗 Additional Resources
- Data- Workbook
September 19, 2023
Mastering 4-Level Map Drill Downs in Tableau

If you've enjoyed my previous tutorials on 2-level and 3-level drill downs in Tableau, prepare to take your skills to the next level.
I've got something unique for you: a step-by-step guide on creating a 4-Level Map Drill Down in Tableau!
What You'll Learn:
- How to drill down from a region to a state
- How to further drill down from a state to a county
- Finally, how to drill down from a county to a city
Prerequisites:
This is an advanced tutorial. Make sure you're comfortable with Tableau basics and have seen my 2-level and 3-level drill down videos.
Previous Videos:
2-Level Drill Down Tutorial
- https://www.vizwiz.com/2022/08/two-level-drill-down.html
- https://www.vizwiz.com/2023/06/map-drill-down.html
3-Level Drill Down Tutorial
- https://www.vizwiz.com/2023/08/dzv-drilldown.html
Links & Resources:
Workbook - https://public.tableau.com/app/profile/andy.kriebel/viz/4-LevelMapDrilldown/MapDrilldown
August 8, 2023
How to Master the 3-Level Drill Down in Tableau (with Dynamic Zone Visibility)

Welcome to my guide on mastering the 3-Level Drill Down in Tableau!
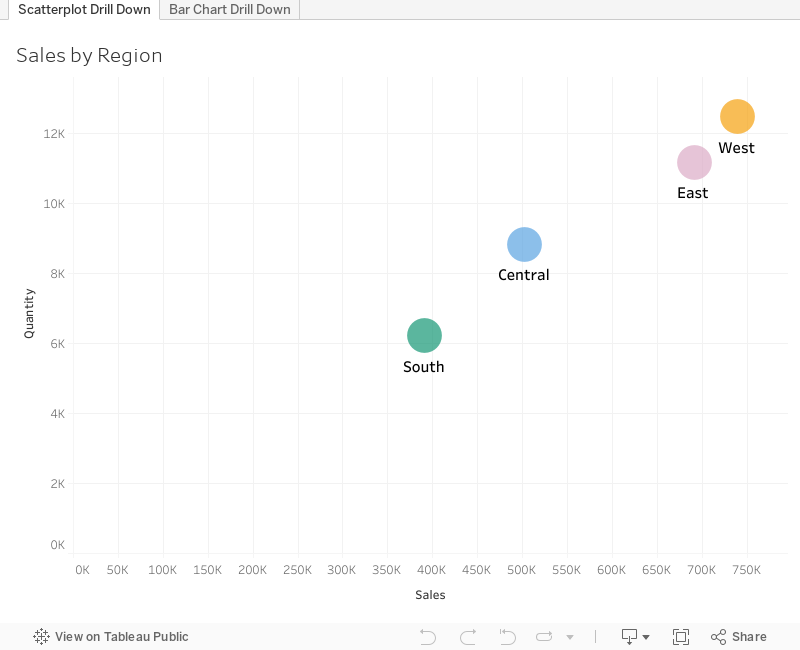
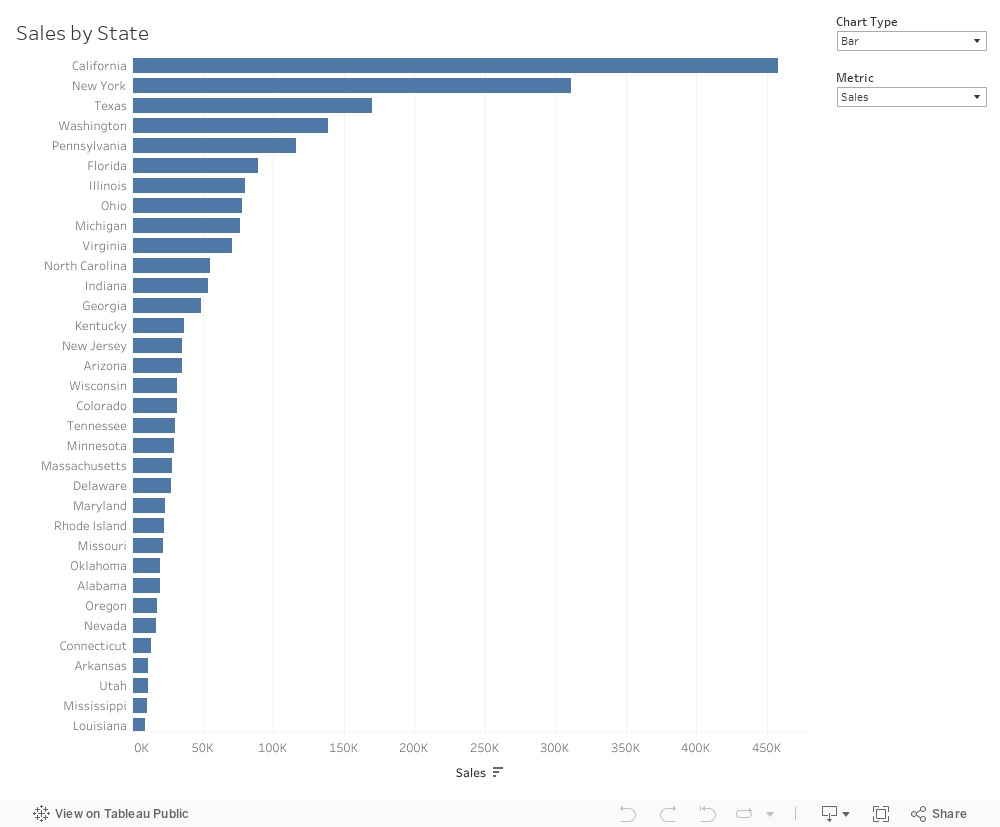
In this tutorial, I show you step-by-step how to make the most of using dynamic zone visibility to create this functionality. We'll go through both scatter plot drill downs from Region → State → Postal code and then replicate that as a bar chart.
You can easily make this a map drill down by changing the chart type. That's it!
🔍 What you'll learn in this video:
1. The basics of drill down functionality in Tableau
2. Hands-on demonstrations, tips, and best practices
3. How to interact with the data
💡 Why is this important?
Drill down capabilities allow analysts to explore data from a broad overview down to granular details. By mastering the 3-level drill down, you can uncover hidden patterns, insights, and trends that might be overlooked in higher-level analyses.
📌 Prerequisites:
A basic understanding of Tableau's interface and primary functions will be helpful, but beginners will be able to follow along as well!
If you are following along, be sure to pause the video along the way as you repeat the steps.
July 31, 2023
#MakeoverMonday 2023 Week 30 - Drinking Fountains in Milan

You'll learn about:
- Joining spatial data sources
- Parameters
- Hexbin maps
- Custom shapes
- Using mapbox maps
- Dashboard layout containers
- Dynamic Zone Visibility
- Parameter Actions
- Custom colors
- Drill down / drill up actions
Enjoy the video and check out the viz below.
July 18, 2023
UNLIMITED Charts, Metrics, and Number Formats in Tableau with Dynamic Zone Visibility

June 14, 2023
SIMPLE Map Drill Down in Tableau with Dynamic Zone Visibility

Creating a drill-down map in Tableau used to be more challenging than it needed to be.
But now, with the dynamic zone visibility, we can create a map drill down in just a couple of simple steps.
By signing up for my newsletter you get:
- Early access to tutorials
- New products
- Discounts
- Access to my new community Discord server
- Notification about any upcoming events and opportunities to learn
and more.
Sign up at andykriebel.com.
🆓 DOWNLOAD the data, plus a starter and completed workbooks:
https://andykriebel.gumroad.com/l/map-drill-down
🥁 See the viz in action:
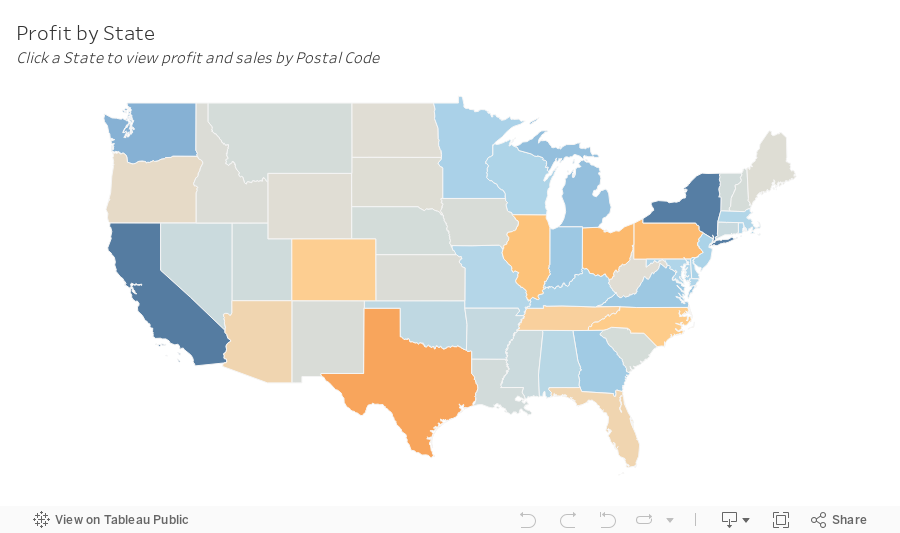
June 12, 2023
#MakeoverMonday 2023 Week 24 - Cereal and the Green Revolution: Yields vs. Land Use

At the global level, how has crop production changed over the last fifty years?
In this Watch Me Viz live stream, I analyzed how the yield and land use of producing cereal has changed over the last 50 years.
I really liked the original visualization, so I rebuilt it in Tableau. I learned how to use dynamic zone visibility, layout containers, and more. Check it out.
Resources:
1. Data - https://data.world/makeovermonday/2023w24
2. Final Dashboard - https://tabsoft.co/3P3Sdl3
===============
Watch Me Viz is a weekly live stream where I help people become better at #Tableau, #PowerBI and data analysis. I show how I take an existing visualization, critique it, analyze the data, and build several visualizations all the while looking for a "better" visualization than the original.
If you are considering participating in Makeover Monday, you can get started by downloading data sets from the Makeover Monday website. I promise you'll become better at data analysis and data visualization by practicing every week.
Data sets - https://www.makeovermonday.co.uk/data/
===============
LEARN FROM ME
Join my newsletter. Sign up at andykriebel.com.
ARE YOU INTERVIEWING FOR A NEW JOB?
Contact me for more information about how I can help you prepare for that big interview.
===============
CONNECT WITH ME
More Watch Me Viz - https://bit.ly/WatchMeViz2023
November 14, 2022
#MakeoverMonday Week 46 - The Cost of Cocaine & Heroin

Quite the interesting topic this week. I get an email from The Economist regularly and there was an article about the wholesale price of cocaine. That led me down a rabbit whole and I found the data, but also for heroin and also for retail prices.
On Watch Me Viz, I stuck with simple lines charts that compared the price for a country to the overall price for all of the countries in the data set. I allow the user to choose a drug and a country.
I then wanted to show how to Dynamic Zone Visibility feature works (if you haven't seen it, be sure to watch it back). In the end, a simple dashboard that compares the measures in two ways, allows for some filtering, looks good, and that's it.
Check out the dashboard below the video.






