June 14, 2023
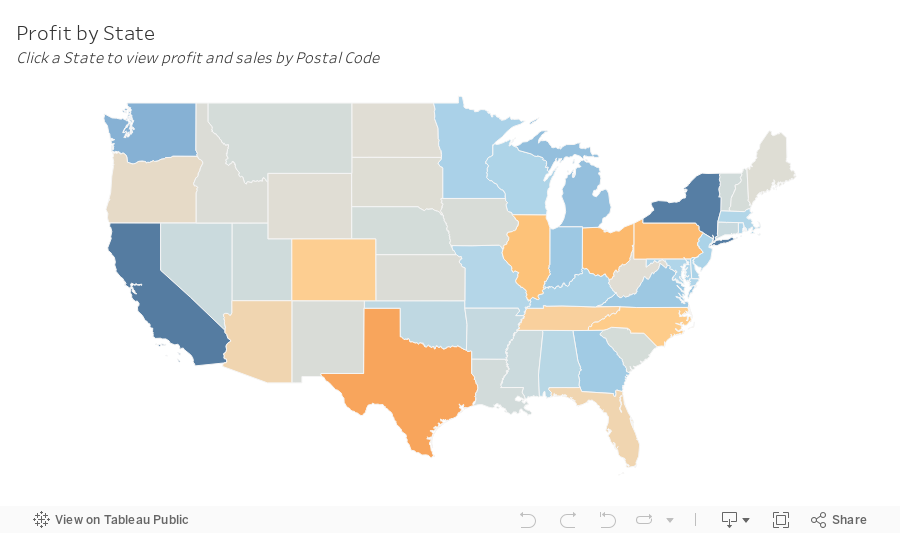
SIMPLE Map Drill Down in Tableau with Dynamic Zone Visibility

Creating a drill-down map in Tableau used to be more challenging than it needed to be.
But now, with the dynamic zone visibility, we can create a map drill down in just a couple of simple steps.
By signing up for my newsletter you get:
- Early access to tutorials
- New products
- Discounts
- Access to my new community Discord server
- Notification about any upcoming events and opportunities to learn
and more.
Sign up at andykriebel.com.
🆓 DOWNLOAD the data, plus a starter and completed workbooks:
https://andykriebel.gumroad.com/l/map-drill-down
🥁 See the viz in action:
May 4, 2023
Tableau Techniques for Top Notch Spatial Analytics

MEMBERSHIP PROGRAM
July 5, 2022
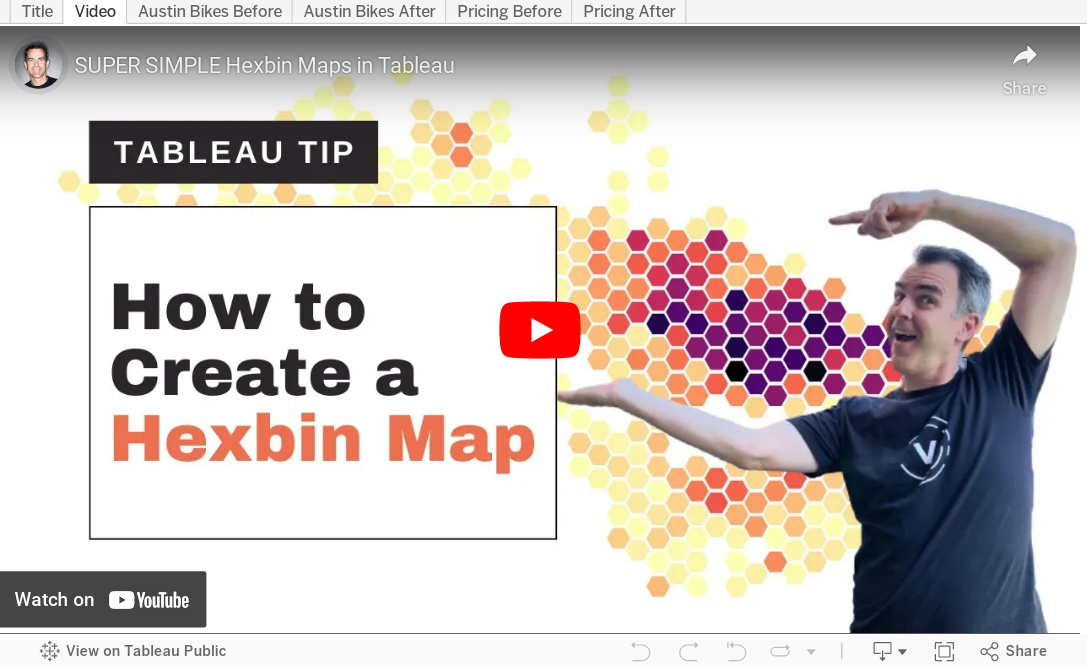
How to Create a Hexbin Map in Tableau
In this tip, I show you how to create a hexbin map in Tableau. But first, let me explain the purpose, benefits and drawback of a hexbin map.
There are countless times when I have been asked to display way too much data on a map. Sometimes I’ve been asked to display thousands of points on a map..but why? I know no one will understand it.
A hexbin map uses hexagons to divide an area into multiple parts and assign a color gradient to each hexagon. This chart type is used to visualize density, where the hexagons dividing the whole space into discrete units of equal size.
This video is going to help you communicate the concentration of data on maps more effectively and give you another option for visualizing geospatial data. I’ll show you how to create a hexbin map based on both the value and the rank, giving you two options depending on your use case.
If you want to follow along, these are the data sources I used:
1. Austin Bike Accidents - https://bit.ly/AustinBikeAccidents
2. Austin Zip Codes Shapefile - https://bit.ly/AustinZipCodes
3. Price Summary - https://bit.ly/PriceSummary
January 25, 2022
How to Calculate the Distance Between Two Points
May 4, 2021
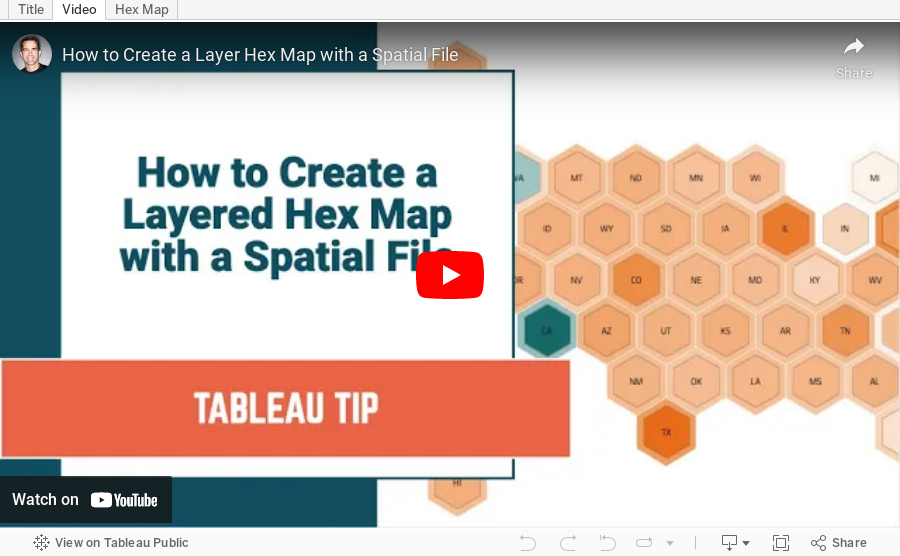
How to Create a Layered Hex Map with a Spatial File

In this tip, I show you how to use a spatial file to overlap hexagons on a map. This technique is much simpler, looks better, and is easier to maintain.
Typically when you want to create an overlapping hex map, you will use a template that has x/y coordinates for the rows and columns, hex shapes, then try to pack them together until they look just right. But then you put them into a dashboard and the sizes need to be adjusted again. What a pain!
Watch this tip to see the simple way to create layered hex maps.
RESOURCE: Hex map template via Joshua Milligan here
February 22, 2021
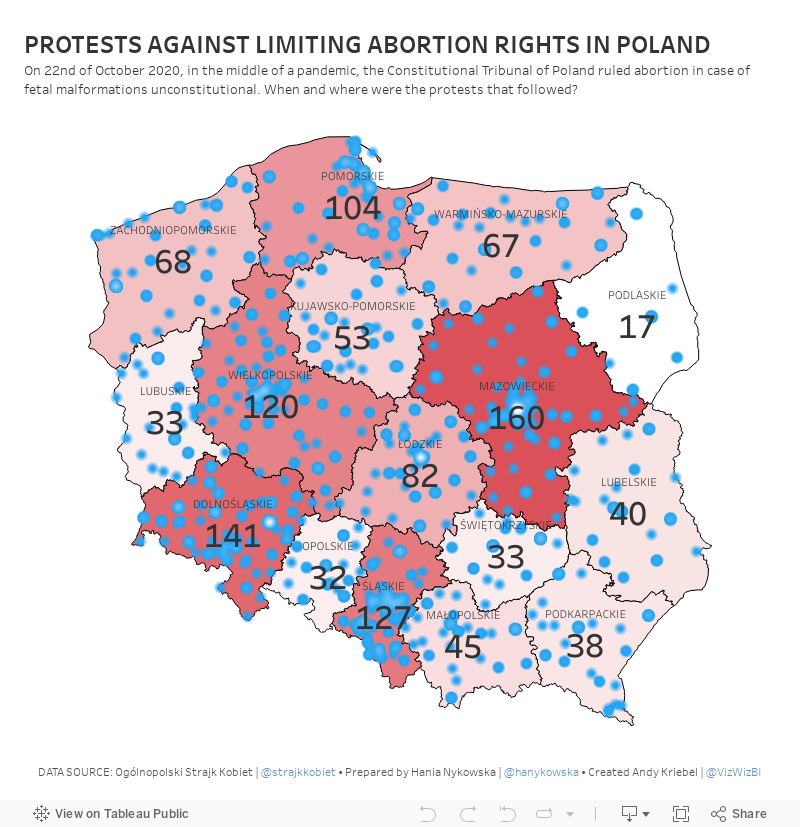
#MakeoverMonday Week 8 - Protests Against Limiting Abortion Rights in Poland

October 20, 2020
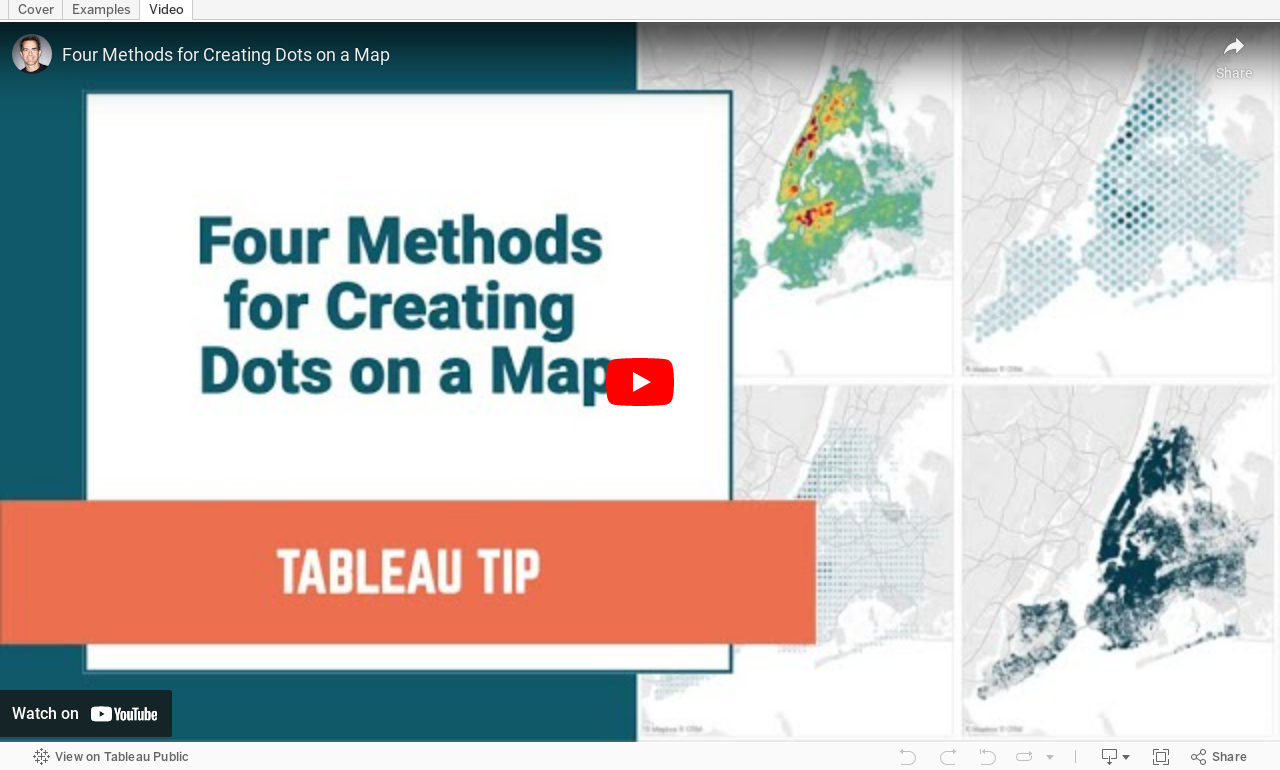
#TableauTipTuesday: Four Methods for Creating Dots on a Map

People love maps. Putting dots on a map gives a sense of precision. There are lots of methods for displaying maps. In this video, I show you four:
- The exact locations
- Density map
- Using the ROUND function to generalize the points
- Using the HEXBIN functions to generalize the points, but at a level controllable by the user