February 22, 2021
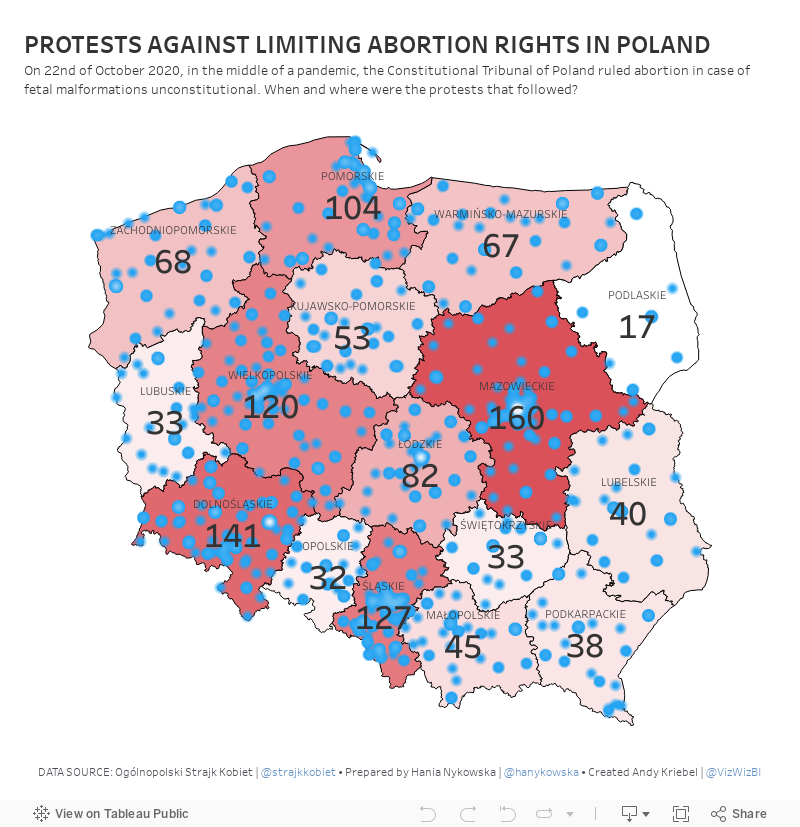
#MakeoverMonday Week 8 - Protests Against Limiting Abortion Rights in Poland

November 19, 2020
Pregnancy, Birth, and Abortion Rates in America

With Amy Coney Barrett being sped through the confirmation process of the US Senate before the 2020 Election (as hypocritical as it was) to become the 9th justice on the Supreme Court, there is now a conservative stranglehold on the judicial branch of government.
Justice Barrett deflected all questions about her stance on abortion during the confirmation process and it has raised lots of speculation that Roe v. Wade will be overturned. Yeah, you know, because the government should control a woman's body, yet there is nothing similar for men. Like, why doesn't a man get castrated if he accidentally impregnates a woman? Blasphemy they say; hypocritical I say.
I wonder if any of the anti-abortion Justice or Congresspeople have ever considered their stance if their daughter had an unplanned pregnancy. What is she got raped and pregnant? I bet their tune would change.
Anyway, my political and social views aside, this made me think about abortion rates in America. Since Roe v. Wade, abortion rates in the US have plummeted.

April 8, 2016
Abortion Regulations - State by State | Hexmaps in Tableau
 |
| Click the image to interact |
Hexmaps…I’ve seen so many great examples of them created in Tableau (and other tools) like this one from Matt Chambers, this one from Ben Moss or this one from Kris Ericsson. Then I saw an article on the Washington Post about abortion regulations that included this series of tile maps...
 |
| Click the image to go to the original |
…and thought this would look much better a series of hexmaps. In addition, I’d never created one before and I wanted to learn how. Fortunately Matt Chambers wrote a blog post for how to create them. I downloaded his workbook, copied the data into Excel, and add the columns I needed. I’ve saved an Excel template you can download here and all you need to do is add the columns you want to use on the color shelf in Tableau.
For my version, I wanted to create a small multiples view with a matrix that shows all states and their regulations in a table you can click to highlight. Special thanks to Robin Kennedy and Matt Chambers for their feedback!!
Two vizzes in one day, two new techniques learned. I’ll chalk it up as a fabulous day!






