VizWiz

Launch, grow, and unlock your career in data
Showing posts with label conservative. Show all posts

November 19, 2020

Pregnancy, Birth, and Abortion Rates in America

No comments

With Amy Coney Barrett being sped through the confirmation process of the US Senate before the 2020 Election (as hypocritical as it was) to become the 9th justice on the Supreme Court, there is now a conservative stranglehold on the judicial branch of government.

Justice Barrett deflected all questions about her stance on abortion during the confirmation process and it has raised lots of speculation that Roe v. Wade will be overturned. Yeah, you know, because the government should control a woman's body, yet there is nothing similar for men. Like, why doesn't a man get castrated if he accidentally impregnates a woman? Blasphemy they say; hypocritical I say.

I wonder if any of the anti-abortion Justice or Congresspeople have ever considered their stance if their daughter had an unplanned pregnancy. What is she got raped and pregnant? I bet their tune would change.

Anyway, my political and social views aside, this made me think about abortion rates in America. Since Roe v. Wade, abortion rates in the US have plummeted.


What the data tells us is that Roe v. Wade has actually led to a REDUCTION in abortions. It also shows us the shift towards women waiting later in their lives to have children. 

All of the data comes from the Guttmacher Institute (I'd highly recommend you read their insights), which I have compiled and prepared. You can download the data here.

The view I wished that the Guttmacher Institute had was a way to view regional trends, State trends and comparisons to U.S. and All Ages data. I decided to create a tile map showing the trends over time, which also allows you to include or exclude the US and All Ages totals. It's an interesting data set to explore. Start with your own age and where you live. What's the situation there?

This was a fun visualization to build and I would like to thank Seffana Mohamed-Ajaz for her feedback and suggestions of some minor tweaks.

Click on the gif below to interact with the visualization. There's an important story to tell and important rights of women to ensure are retained.

October 7, 2019

#MakeoverMonday: Bearwood Corporate Services - The Money Behind David Cameron's Conservative Party

No comments
What a fascinating data set! More on that in a minute. First, let's have a look at this week's viz to makeover. It comes from The Electoral Commission and focuses on political donations in the UK, which are required to be reported.

SOURCE: THE ELECTORAL COMMISSION

WHAT WORKS WELL?
  • Placing the filters on the upper right let me know immediately that I can interact with the data to find my own story.
  • The bar chart is sorted in descending order.
  • The summary numbers provide some context, but not much.

WHAT COULD BE IMPROVED?
  • The bar chart would be easier to read if it was horizontal.
  • Why are all of the bars colored? There are way too many colors and they have no meaning.
  • The packed bubbles would be much better as a bar chart or BANs.
WHAT I DID
I started by exploring each field in the data set. Many of them didn't have information I found useful, so I hid all of those fields so that they would not distract from my analysis. 

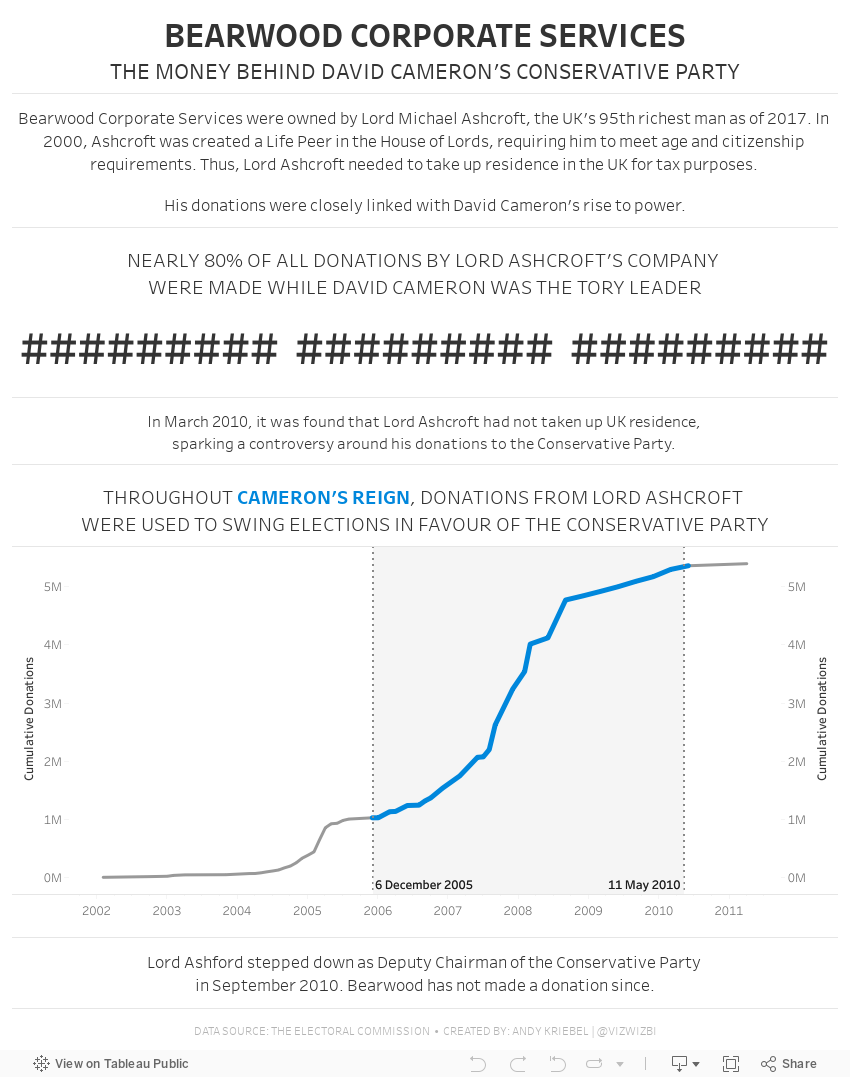
As I explored the donors and who gave what to whom, I saw that Bearwood Corporate Services was donating A LOT to the Conservative Party over a period of a few years. I hadn't heard of it before so I did some research on Google and it turns out that they were pretty controversial and closely linked to the rise to power of David Cameron.

That's where my story begins...

