April 21, 2022
#B2VB - 2022/W4 - Design Some KPIs
area chart
,
b2vb
,
BAN
,
bar chart
,
boolean
,
charts
,
color
,
dual axis
,
formatting
,
KPI
,
line chart
,
shape
,
square
,
tableau
,
text
,
tips
,
title
,
triangle
,
WatchMeViz
No comments
In this session, I worked on Back to Viz Basics (#B2VB) week 4 and designed as many KPIs as I could in an hour. The video and workbook are below the resources and links.Resources:
KPI Samples from Tableau Public:
* Adam McCann - https://public.tableau.com/app/profile/adam.e.mccann/viz/SingleSheetKPIDashboard/NewKPIBlurDashboard
* Priya Padham - https://public.tableau.com/app/profile/p.padham/viz/KPIDashboardMarketing/KPIDashboard
* Will Perkins - https://public.tableau.com/app/profile/will.perkins/viz/KPIView-RecreationDashboard/DashboardRecreation
* Brian Moore - https://public.tableau.com/app/profile/brian.moore7221/viz/VizConnect-SuperstoreKPIDashboard/ExecutiveKPIDashboard
* Ludovic Tavernier - https://public.tableau.com/app/profile/ludovic.tavernier/viz/RETAIL-POS-PointofSalesDashboard-Redesign/Cockpit-POS-Redesign
* Ellen Blackburn - https://public.tableau.com/app/profile/ellen4268/viz/InfoLabTemplate/InfolabTemplate

April 19, 2022
How to Calculate YTD vs. Prior YTD Based on a Selected Date
analysis
,
boolean
,
calculated field
,
change
,
comparison
,
context
,
difference
,
how to
,
parameter
,
percent change
,
prior year to date
,
tableau
,
tip
,
tutorial
,
variance
,
year over year
,
year to date
No comments
April 12, 2022
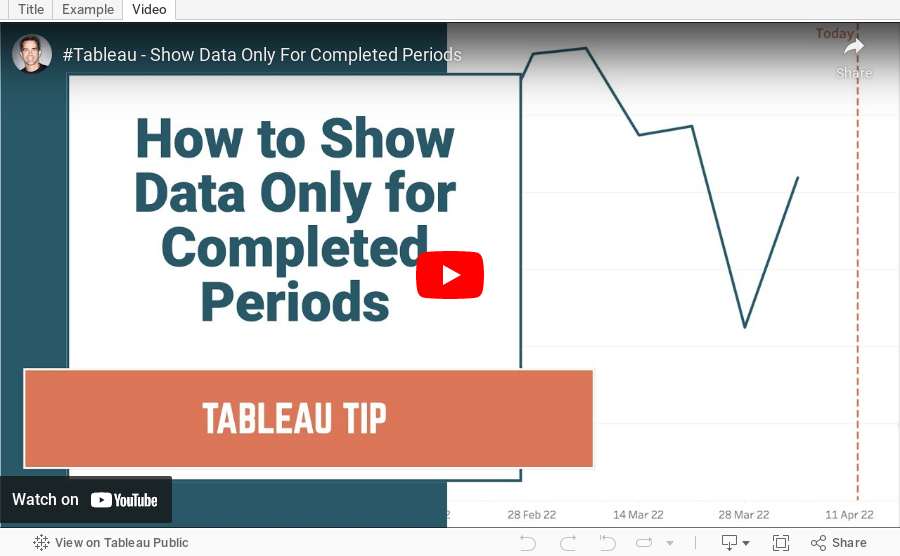
How to Show Data for Only Completed Periods
boolean
,
calculated field
,
chart
,
comparison
,
complete
,
context
,
date
,
filter
,
graph
,
how to
,
line chart
,
month
,
quarter
,
tableau
,
tip
,
tutorial
,
week
,
year
No comments
April 5, 2022
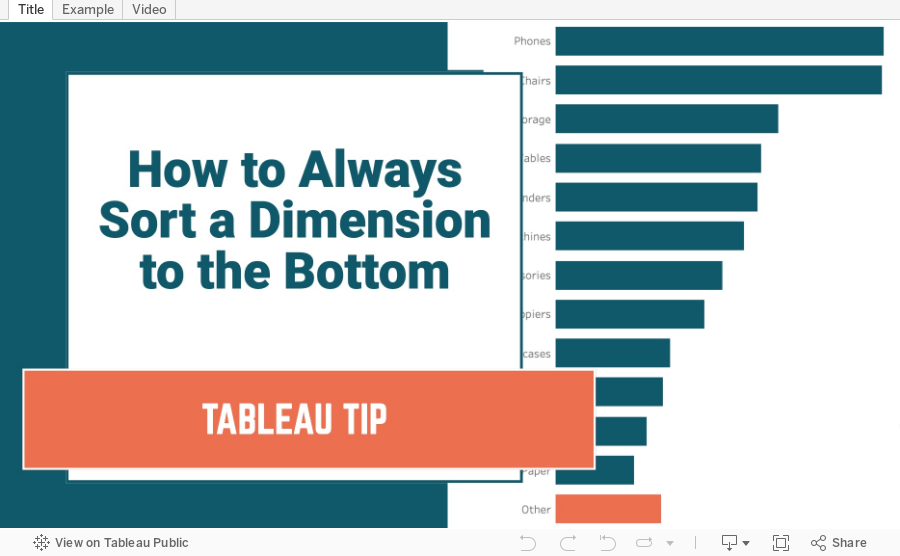
How to Always Sort a Dimension to the Bottom of a Chart
ascending
,
bar chart
,
calculated field
,
chart
,
comparison
,
context
,
descending
,
dimension
,
graph
,
group
,
highlight
,
how to
,
negative
,
sort
,
sorting
,
tableau
,
tip
,
tutorial
No comments
Subscribe to:
Posts
(
Atom
)


