VizWiz

Launch, grow, and unlock your career in data
Showing posts with label dimension. Show all posts

May 26, 2024

How to Create a Barcode Chart in Tableau

No comments
Like dot strip plots, barcode charts are good for displaying all the data in a table, they work best when highlighting individual values.

May 1, 2024

How to Create a Cycle Plot in Tableau

No comments
A cycle plot is used to display cyclical patterns or trends over time, such as days of the week or months, to identify patterns, compare groups, and visualize seasonality in data.

April 18, 2024

Which chart would you like to show?

No comments

Beginners and advanced designers alike get stuck deciding which chart is right for their data. Next time you're stuck, try this chart guide by Damola Ladipo.

Check it out on Tableau Public here. Click the image below for a hi-res version to print.

August 23, 2023

#MakeoverMonday Week 34 - Go-To Drinks for Men and Women on Dates

No comments

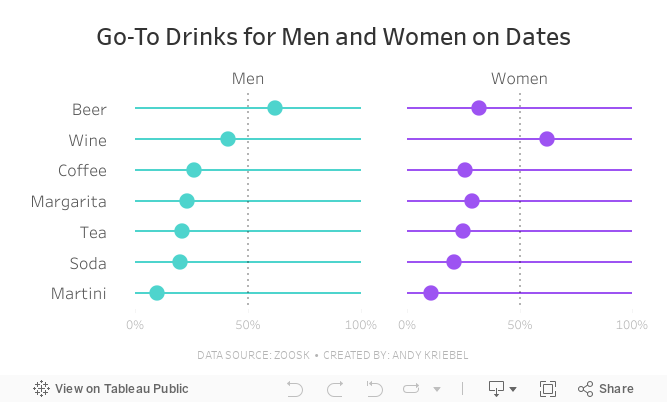
Join me for live analysis of Zoosk's recent survey, covering 8,793 members' dating drink preferences! 

In this livestream, I'll break down the responses across 7 different drink types, comparing the preferences between men and women. 

Is there a gender divide when it comes to what people choose to drink on dates?  

I'll explore this question and more. 
July 18, 2023

UNLIMITED Charts, Metrics, and Number Formats in Tableau with Dynamic Zone Visibility

No comments
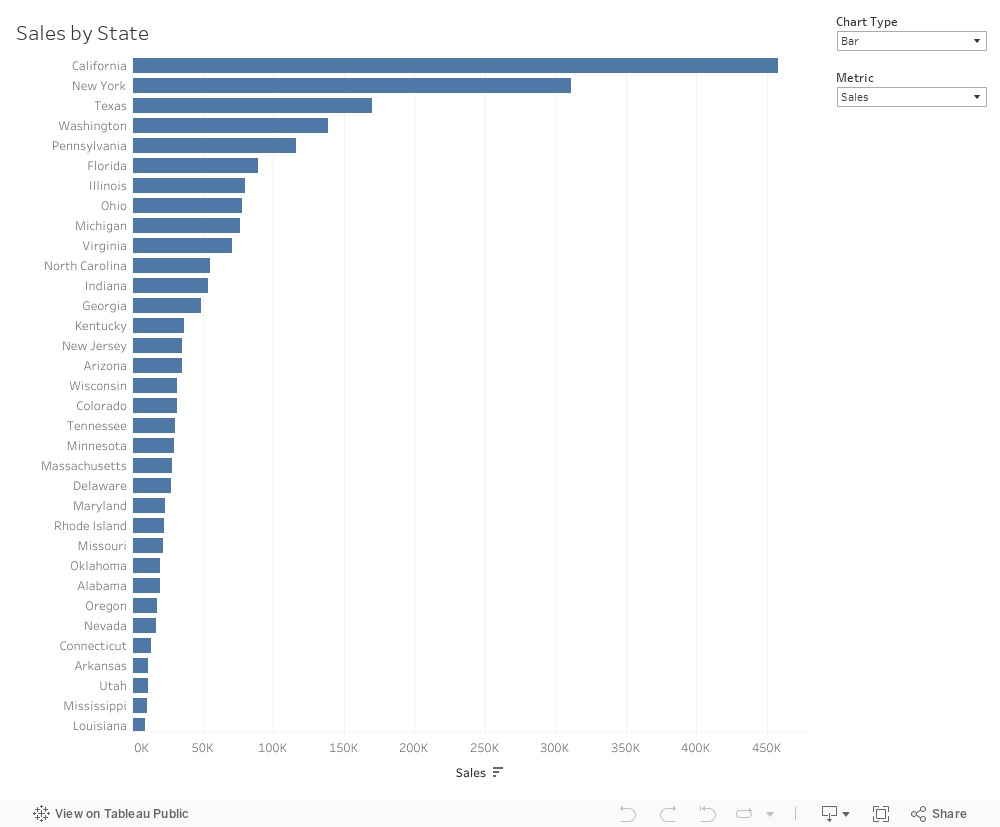
Dynamic zone visibility opens up so many use cases. Previously, I had to do some number formatting tricks to show two different formats on one chart.

But with DZV, I can create an unlimited number of combinations of charts, metrics, and number formats.

In this video, I show you four examples to get you started. 

Download the workbook here. Interact with it below the video.


June 27, 2023

Blue vs. Green - What does it mean?

No comments

When I first started using #Tableau, I assumed that blue meant dimensions and green meant measures. They don’t.

Blue means Discrete
Green means Continuous

It took me a couple of years to get my head around this most foundational concept in Tableau.

Dimensions and measures are merely a way that Tableau organizes the data.

And if you only take away one thing from this video, this is it:

  • Blue things GROUP your data
  • Green things COUNT your data
  • Dimensions SPLIT up the view
  • Measures FILL the view
I've spent years teaching people what blue and green mean in Tableau and I keep coming up with new methods. In this video, I’ll explain the entire concept to you.


September 15, 2022

Table Calculations vs. Level of Detail Expressions - % of Total

No comments
In this video, I show you the difference between table calculations and level of detail expressions with the % of total calculation. I review: 

  1. How to compute a % of total with a table calc 
  2. How to compute a % of total with an LOD 
  3. How filters impact these calculations 
  4. How context filters impact level of detail expressions 
  5. Tableau's order of operations 

Download the workbook here. Download the order of operations chart here.

June 28, 2022

How to Use the Highlighter to Set a Default Color Palette

No comments
Let's say you have a view with lots of marks and you want highlight a specific mark and assign a color palette so that mark is always highlighted whenever that dimension is used, irrespective of the chart.

To do this you can Highlight one or more discrete fields from the color palette and assign those marks to be highlighted. This does not impact the level of detail in the view.

Here's how you do it:

June 22, 2022

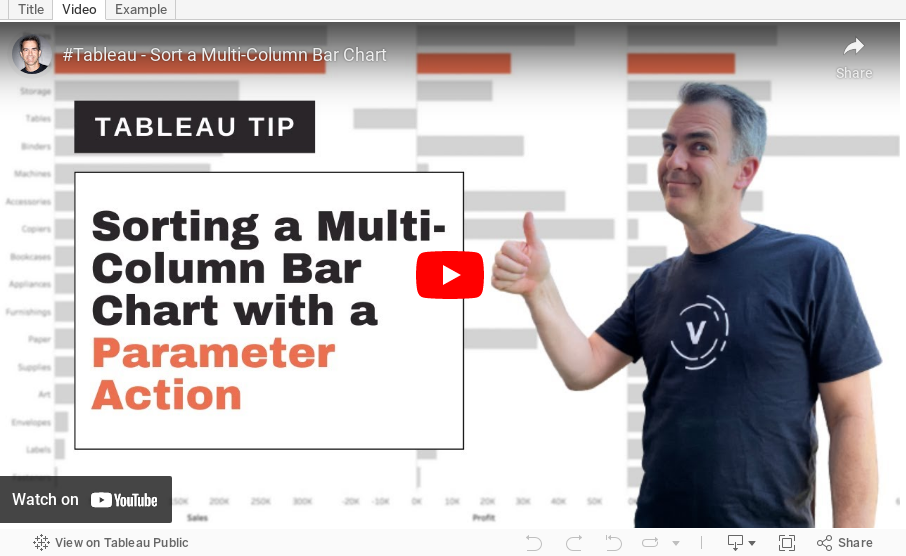
How to Sort a Multi-Column Bar Chart with a Parameter Action
No comments
Let's say you have a chart with 1 dimension and 3 measures. You want to make sorting the bar chart by any of the measures as easy as possible. In this tip, I show you how to use parameter actions to sort the bar charts based on the measure you select.

April 5, 2022

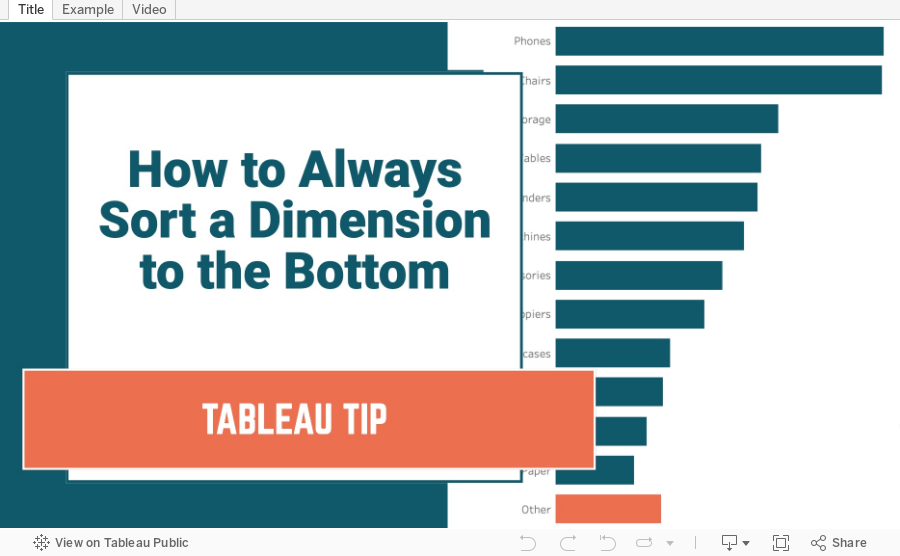
How to Always Sort a Dimension to the Bottom of a Chart
No comments
In this tip, I show you how to use a calculated field to always sort a specific dimension to the bottom of a chart. You can also always have a dimension at the top, you simply change the sort from Descending to Ascending. This also works with column charts that sort left-to-right.


March 1, 2022

How to Create a Dual Axis Chart with One Dimension and One Measure

No comments

This tip comes from a comment from a viewer. They wanted to know how they could build a dual-axis chart based on a single dimension (e.g., Order Date) and a single measure (e.g., Sales). In this tip I show you how to compare the monthly sales for the current year (as a line) to the prior year (as a bar).


February 9, 2021

How to Assign Highlight Colors to Palette

No comments
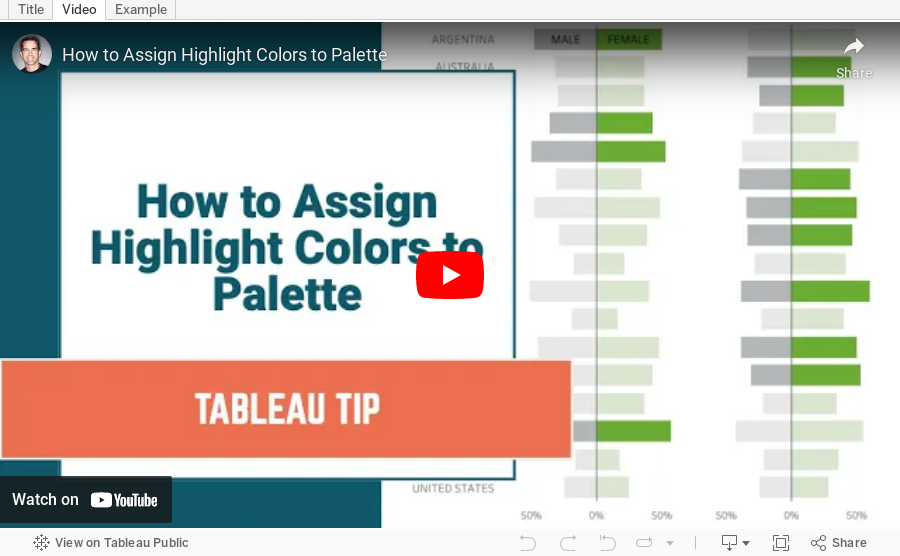
You can use a parameter to highlight a particular dimension in a chart. But there's a much easier and quicker method. The option is on the color legend. 

It's simple:

1. Click on a color to highlight it.
2. From the color legend drop down, choose Assign Highlight Colors to Palette.

February 4, 2021

How to Add Zeros for Missing Time Series Data

No comments
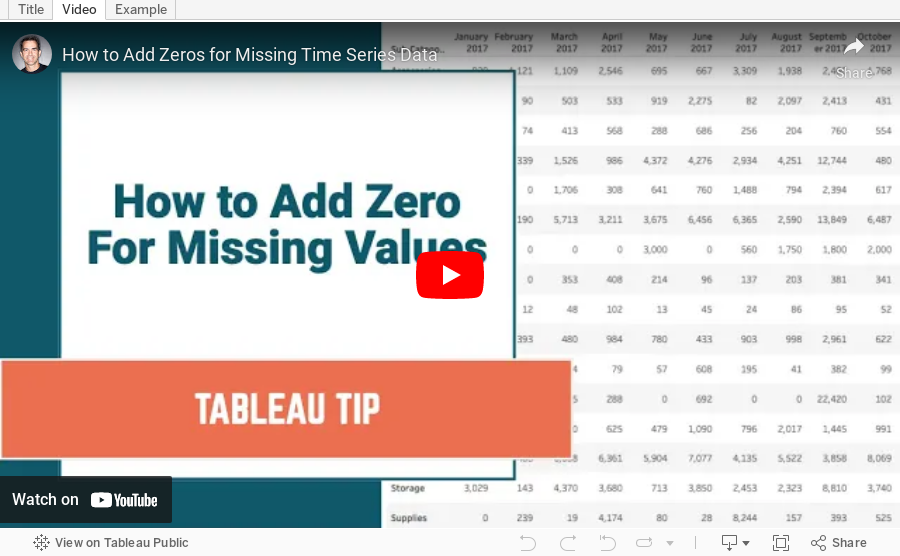
When working with time series data, Tableau understands how to populate dates that don't exist. For example, if you have sales for Jan 3 and Jan 5, Tableau can "add" data for Jan 4.

Great! But then you want to show zero in that cell. This tip shows you how to do just that.

April 7, 2020

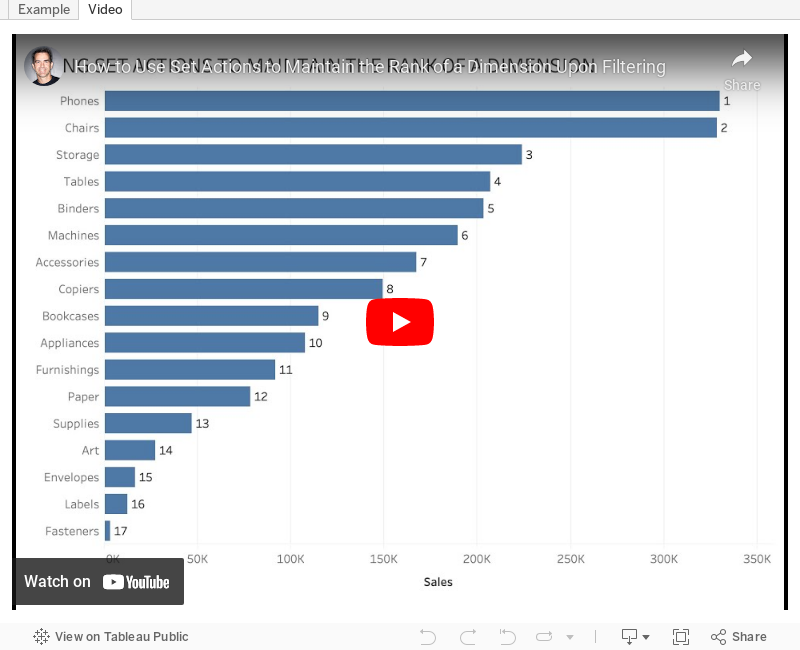
#TableauTipTuesday: How to Use Set Actions to Maintain the Rank of a Dimension Upon Filtering

No comments
One of the drawback of filtering a dimension is that you will lose the rank of a dimension relative to others. This happens because of Tableau's order of operations which dictate that a dimension filter takes effect before a table calculation (rank in this case).

This video shows you how to use Set Actions to filter a dimension while also maintaining the rank.
September 6, 2016

Tableau Tip Tuesday: Using a Level of Detail Expression to Summarize Dimensions

This week’s tip goes back to a tip I wrote in 2012 that required table calculations. With the addition of Level of Detail expressions in Tableau 9, the need for a table calc is obsolete.