Showing posts with label continuous. Show all posts
April 21, 2024
How to Create Custom Date Hierarchies in Tableau
continuous
,
custom
,
custom dates
,
data analysis
,
date drill down
,
dates
,
discrete
,
drill down
,
hierarchy
,
tableau
No comments
Custom date hierarchies are one of the most underutilized features in Tableau. They allow you to define specific drill-downs not automatically available.
For example, you may want to allow your users to only drill-down from Year to Month.
April 20, 2024
The What, Why, and How of Custom Dates in Tableau
continuous
,
custom dates
,
date part
,
date value
,
discrete
,
how to
,
tableau
No comments
Custom dates allow users to define the level of granularity and format of the date field according to their specific needs based on existing date fields in the data.
They are useful when you want to restrict drill-down options or create sets for specific date ranges.
Here's how to create them.
June 27, 2023
Blue vs. Green - What does it mean?
aggregate
,
blue
,
continuous
,
continuous dimension
,
continuous measure
,
count
,
dimension
,
disaggregate
,
discrete
,
discrete dimension
,
discrete measure
,
fill
,
green
,
group
,
headers
,
how to
,
measure
,
split
,
tableau
No comments

When I first started using #Tableau, I assumed that blue meant dimensions and green meant measures. They don’t.
Blue means Discrete
Green means Continuous
It took me a couple of years to get my head around this most foundational concept in Tableau.
Dimensions and measures are merely a way that Tableau organizes the data.
And if you only take away one thing from this video, this is it:
- Blue things GROUP your data
- Green things COUNT your data
- Dimensions SPLIT up the view
- Measures FILL the view
June 22, 2022
How to Sort a Multi-Column Bar Chart with a Parameter Action
bar chart
,
calculated field
,
case statement
,
chart
,
condition
,
continuous
,
dimension
,
discrete
,
graph
,
highlight action
,
how to
,
measure
,
parameter action
,
set action
,
sort
,
tableau
,
tip
,
tutorial
,
worksheet action
No comments

February 23, 2021
Four Methods for Creating a Seismogram
chart
,
circle timeline
,
color
,
continuous
,
date
,
discrete
,
gantt
,
graph
,
highlight
,
how to
,
line
,
measure names
,
measure values
,
path
,
seismogram
,
tableau tip
,
tutorial
No comments

A Seismogram is an alternative to a circle timeline. They are a great way of showing change over time, and are particularly effective when there are big variations in the dataset.
In this video, I show you how to build several version of a Seismogram:
1. Discrete Dates with horizontal lines
2. Continuous Dates with horizontal lines
3. Continuous Dates with vertical lines
4. Gantt chart Seismogram

December 18, 2018
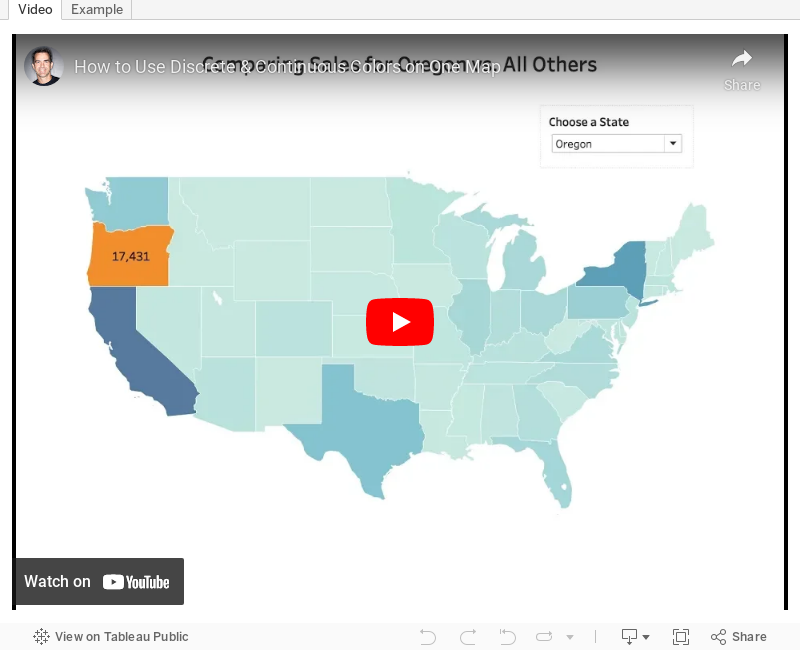
Tableau Tip Tuesday: Using Discrete & Continuous Colors on One Map
color
,
continuous
,
discrete
,
dual axis
,
layer
,
layering
,
map
,
Tableau Tip Tuesday
No comments

A couple weeks ago,
This is quite simple if you know how to layer maps and take advantage of multiple marks cards. I show you how to do just that in this week's tip.
Enjoy!
August 9, 2017
Workout Wednesday: Continuous Dates are Tricky
calculation
,
continuous
,
dates
,
forums
,
Jonathan Drummey
,
level of detail
,
month day
,
running total
,
Workout Wednesday
4 comments

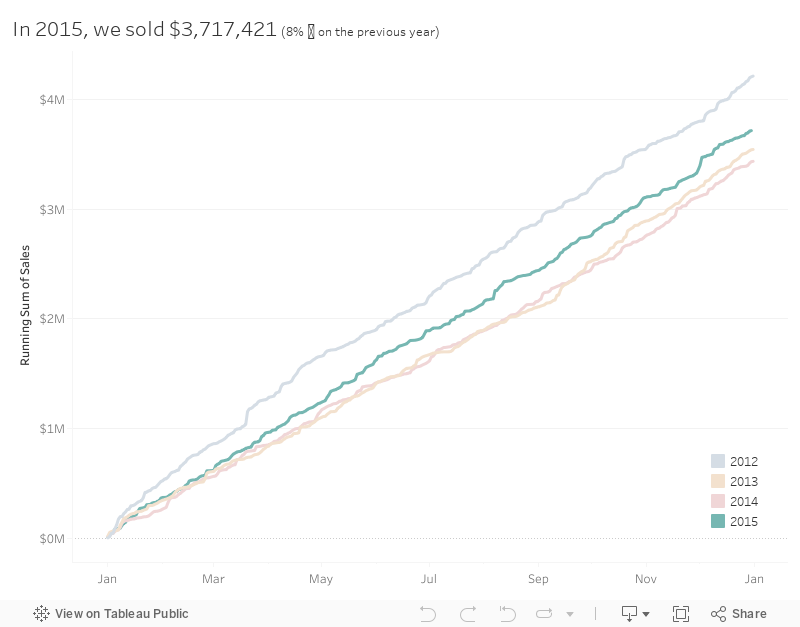
Her requirements are pretty straightforward. I was able to get everything quickly with the exception of the month labels on the x-axis.
FIRST ATTEMPT
To do the line chart, I created a Day of Year calc and plotted that on the x-axis. Notice this results in the day number on the scale.
SECOND ATTEMPT
To format the scale, I first changed the number format to mmm to give me month abbreviations. That gets me close, but some months are missing and the months are labeled at the middle of the month whereas Emma's are labeled at the start of the month.
THIRD ATTEMPT
I sent Emma a message with a few questions, basically because I was stuck. All she said was:You'll have to re-think the date you have on the x-axis so you can also colour by year.
What does that even mean? I'm beginning to get a sense for the sort of torture I put people through. Ok, so I somehow need to get my x-axis to act like a date, yet still be able to show every day for each year in the view. I also need it to only be month and day. Hmmm: Hey Google, can you help?
Yes indeed! I searched for "tableau month and day of year" and the second search result took me to the Forums which had exactly the question I was asking. The brilliant Jonathan Drummey came up with this formula:
DATE(DATEADD('day',DATEPART('day',[Date]),DATEADD('month',DATEPART('month',[Date])-1,#1903-12-31#)))
Sweet! All I needed to do was swap out [Date] for [Order Date] and I was good to go. Now I have the exact result I needed.
Awesome challenge! I love learning something new! Here's my final product.
March 21, 2017
Tableau Tip Tuesday: How to Create a Full Year Heatmap Calendar with Month Labels
axis
,
calendar
,
continuous
,
heatmap
,
Kevin Taylor
,
labels
,
months
,
stock
,
Tableau Tip Tuesday
5 comments
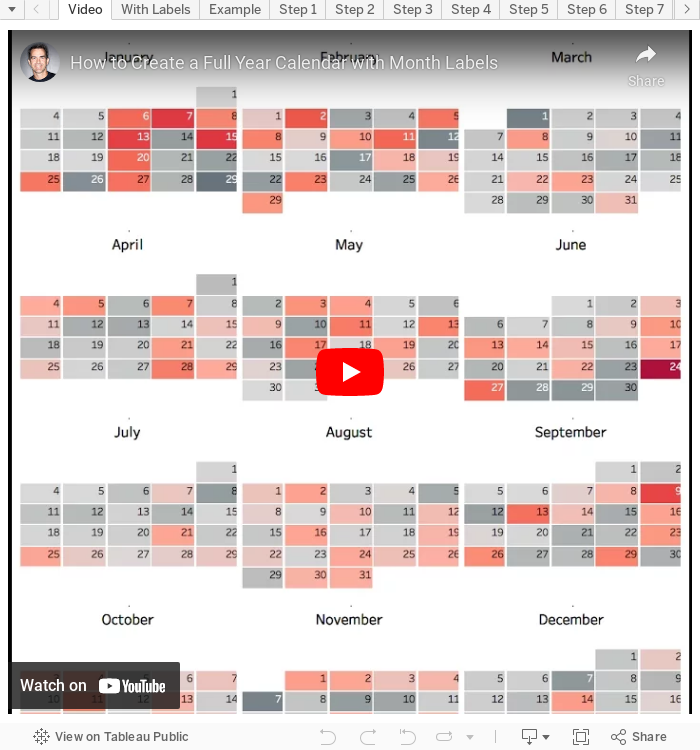
This week's video is an extension of the great blog post by Kevin Taylor on the Tableau blog about how to create full year heatmap calendars. This video shows you how to add month labels to the visualisation.

February 9, 2016
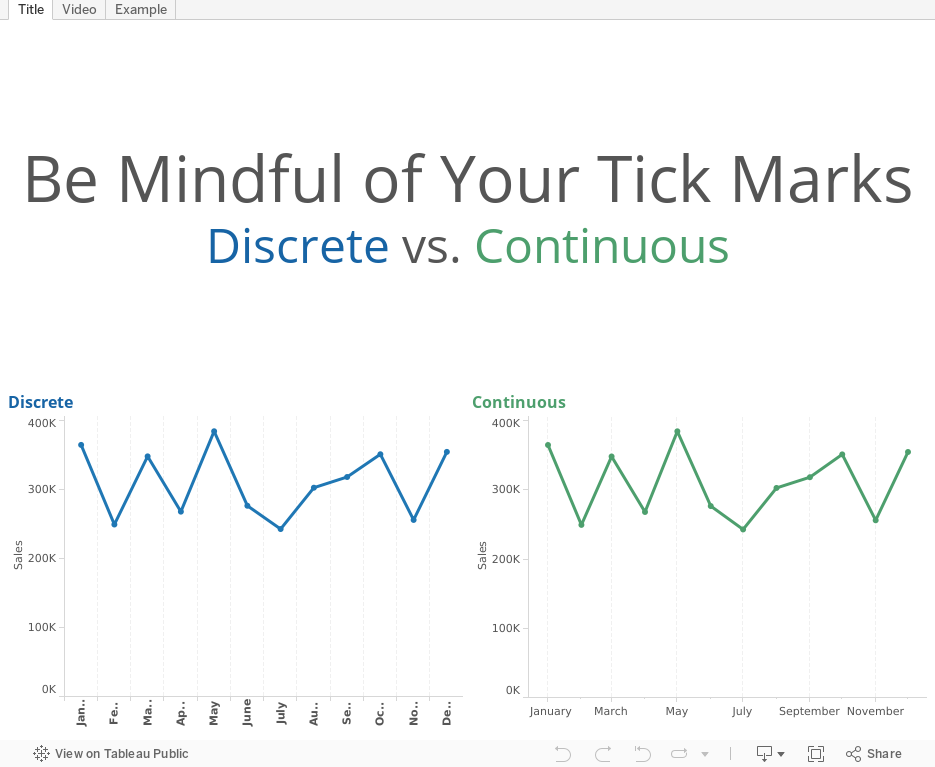
Tableau Tip Tuesday: How Discrete & Continuous Dimensions Affect Your Tick Marks & Gridlines

August 29, 2014
Two-way Sorting in Tableau - Sorting Some of the Viz by a Measure and the Rest Alphabetically
airport
,
calculated field
,
continuous
,
crosstab
,
date
,
delay
,
discrete
,
formatting
,
sparklines
,
table calculation
,
tableau
,
tips
,
travel
,
tricks
10 comments
I had an interesting requirement posed to me yesterday that I hadn't ever run into before. I'm using this Airline Delays data to demonstrate the technique. The requirements were along these lines:
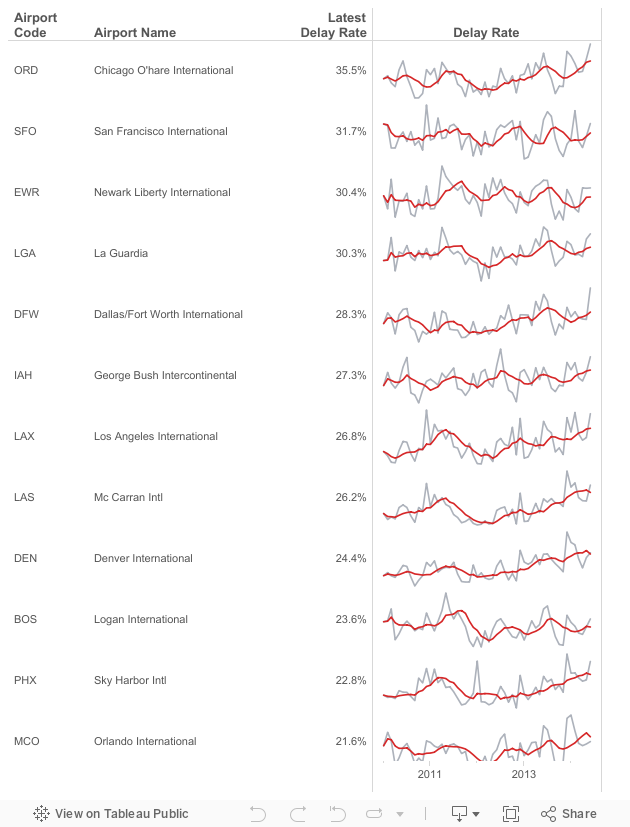
- Given a list of airports, there are a subset that are "targets". Let's assume they are the top 15 with the most flights in 2014: ATL, DFW, ORD, LAX, DEN, IAH, SFO, PHX, LAS, MCO, CLT, EWR, BOS, SLC, LGA
- The airports need to be sorted by the latest delay rate. However, only those in my top 15 list should be sorted by delay rate, the rest should be sorted alphabetically to make them easier to lookup.
- Include sparklines for each airport for 2010 to present.
This is the final product and here's how I went about solving this problem. There could very well be a more efficient method, but this worked for me.
Subscribe to:
Posts
(
Atom
)






