November 30, 2015
Makeover Monday: The Budget of A 25-Year-Old
bar chart
,
budget
,
comparison
,
Makeover Monday
,
pie chart
,
slope graph
,
year over year
No comments

Several months ago, I read this interesting article about a 25-yr old that was tracking his expenses and how he was choosing to budget his money. The author of the article chose to show the breakdown of the budget as two separate pie charts. This wasn't a surprising choice as it's the first way we learn to show parts to whole in school. The problem of choosing a pie is compounded by including a second pie for the next year, to which you are expected to make comparisons.
So, in this week's Makeover Monday, I walk through a better way to show this data. Enjoy!

November 23, 2015
Makeover Monday: Stephen Curry is Taking 3-Point Shooting to a New Extreme
I’m sticking with my recent focus on the NBA and in particular Stephen Curry and the Golden State Warriors. This week, I walk you through a makeover of a chart produced by Sports Insider. In this makeover, I point out what’s wrong with the chart and show the makeover in terms of a story rather than one static chart.

November 21, 2015
The Golden State Warriors Have the Most Efficient Payroll in the NBA
First let me start by saying that this post is an update to a previous post I had written in which I indicated that Brian Windhorst of ESPN didn’t have his facts straight about the Warriors payroll. Indeed he was correct. My apologies to Brian and my thanks to reader Trevor who pointed out that the data I had used was from 2013 and that the 2015 data matches Brian’s statement.
With that being said, I decided to re-work the story and elaborate on Brian’s point. In this story, I walk through an analysis of NBA payrolls versus winning percentage.
With that being said, I decided to re-work the story and elaborate on Brian’s point. In this story, I walk through an analysis of NBA payrolls versus winning percentage.

November 19, 2015
Philadelphia Has the Worst Sports Teams in North America
I was listening to Sports Radio WIP yesterday as I was driving to get a cup of delicious Dunkin Donuts coffee. I heard one of the hosts talk about how Philly is the worst sports city in all of North America for cities that have teams in all four major sports leagues. A quick Google search turned up this article.
How bad are Philly sports teams?
I took the ugly table of numbers from the article and built the interactive dashboard you see below, confirming my worst fears.
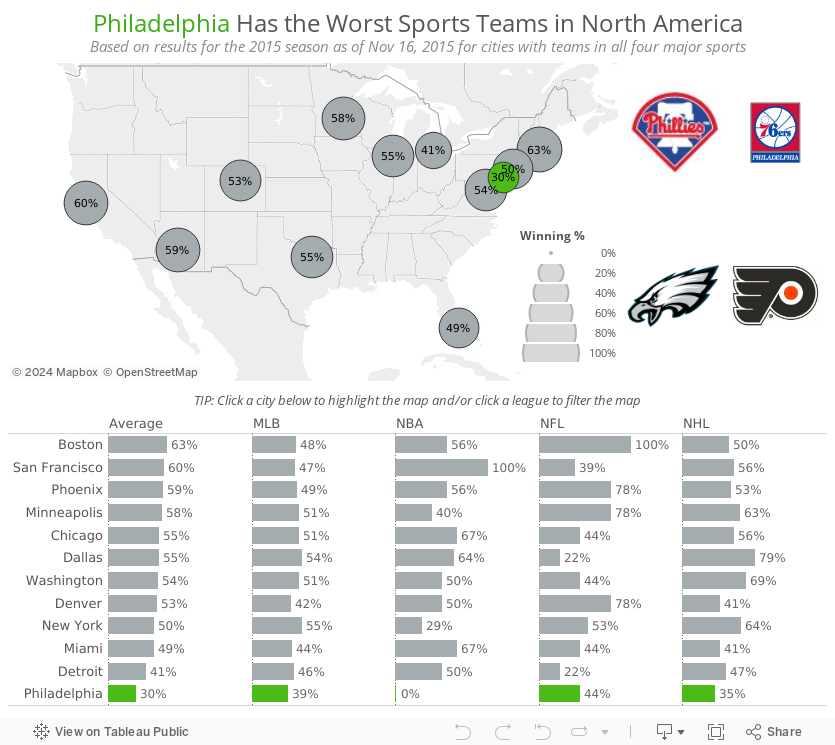
This merely confirms the misery that is being a Philadelphia sports fan.
How bad are Philly sports teams?
- The Eagles are more or less unwatchable. They’re inventing new ways to lose.
- The 76ers have lost 20+ games in a row. That’s really, really hard to do in the NBA.
- The Flyers couldn’t score if there was no goalie in the opposing net.
- The Phillies…well, they did their best to be one of the worst baseball teams of all-time.
I took the ugly table of numbers from the article and built the interactive dashboard you see below, confirming my worst fears.
This merely confirms the misery that is being a Philadelphia sports fan.

Dear Data Two | Week 29: My Wife
Dear Data Two
,
KPI
,
line chart
,
milestone
,
shapes
,
wife
4 comments
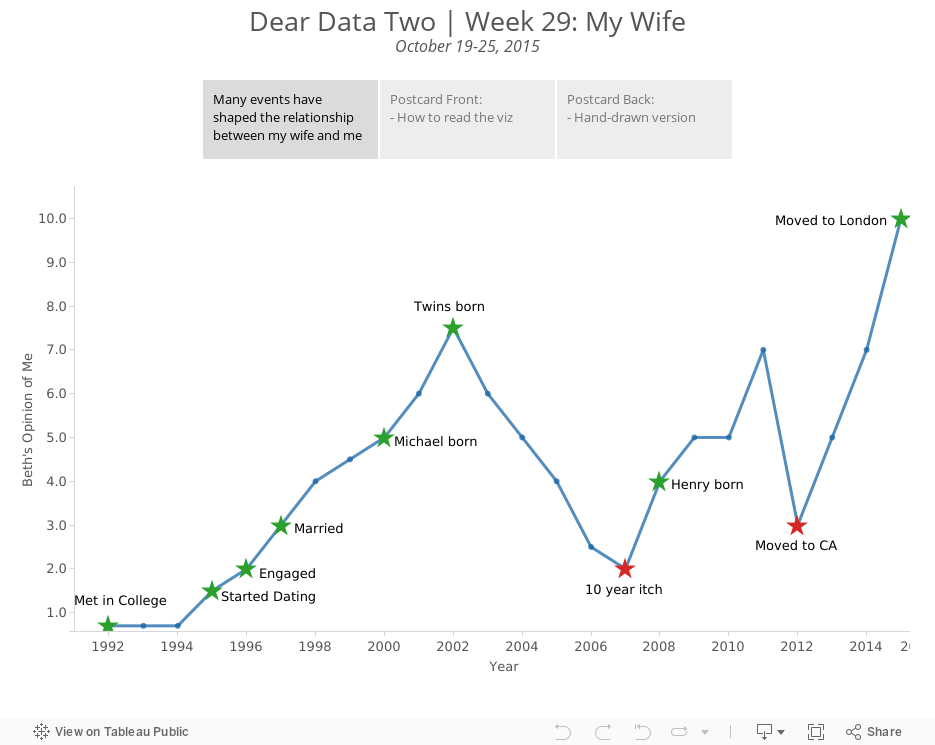
Week 29 had me all over the place. The topic of “my wife” was so broad that I had a bad case of analysis paralysis. Should I track her movements? Should I ask her to track something? Should I analyze all of the wonderful pictures she’s taken? Should I do a word analysis of her blog?
I then had a chat with my boss, Tom Brown, and in his Tom Brown way, he said that I should simply track the number of wives I’ve had over time. Well, I went with that idea and added a twist. At our #DATA15 presentation, I talked about the wife KPI, so what I decided to do is create a chart of the wife KPI since Beth and I first met in 1992.
From there I added major milestones to the dataset, categorised those event as positive or negative, then built a simple line chart. It's really interesting to me to see the ebbs and flows of our relationship. I would have never noticed it if I didn't see it depicted on a graph this way.
Note that on this postcard, I intentionally used red/green to indicate bad/good. I preach to people not to do this if they don’t know if their audience is colour-blind. In this case, my audience of 2 (Jeff and my wife) are not colour-blind, so I knew it would work.
November 17, 2015
Tableau Tip Tuesday: Aligning Time - An Analysis of the Greatest 3-Point Shooters of All-Time
basketball
,
cumulative
,
Golden State Warriors
,
line chart
,
NBA
,
stats
,
Stephen Curry
,
Tableau Tip Tuesday
,
video
In this week’s tip, I review how to align measures that start at different time periods in order to understand how Stephen Curry compares to the greatest NBA 3-point shooters of all-time. In order to do that, I need to create a table calculation to align the seasons each player played.
Click on the video tab to see how I built this.
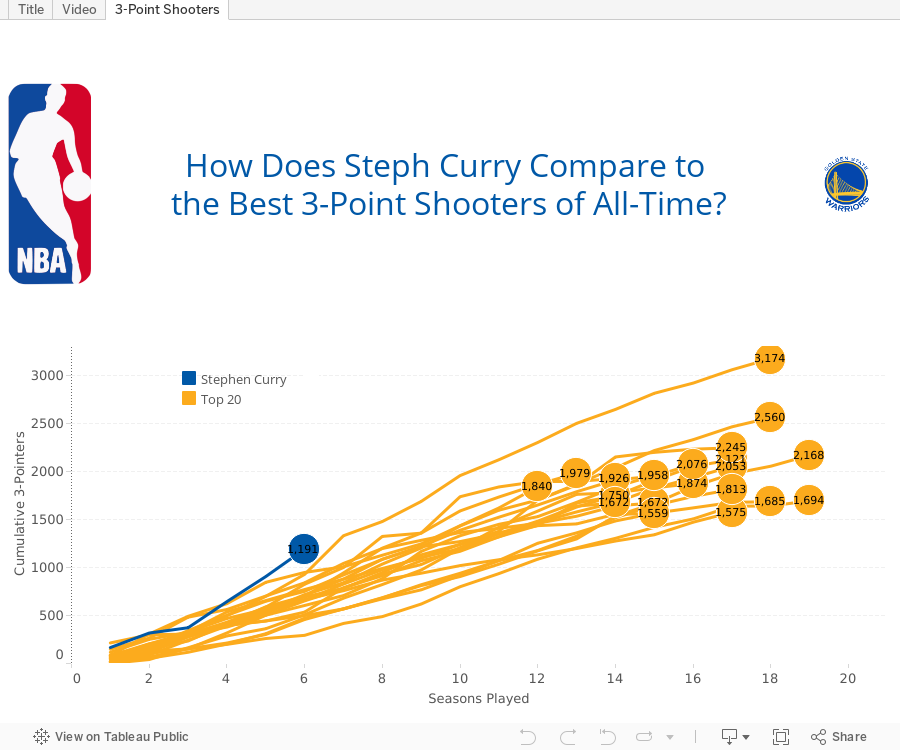
SPOILER: At this point in his career, Curry is far and away the best 3-point shooter of all time.

Click on the video tab to see how I built this.
SPOILER: At this point in his career, Curry is far and away the best 3-point shooter of all time.
November 16, 2015
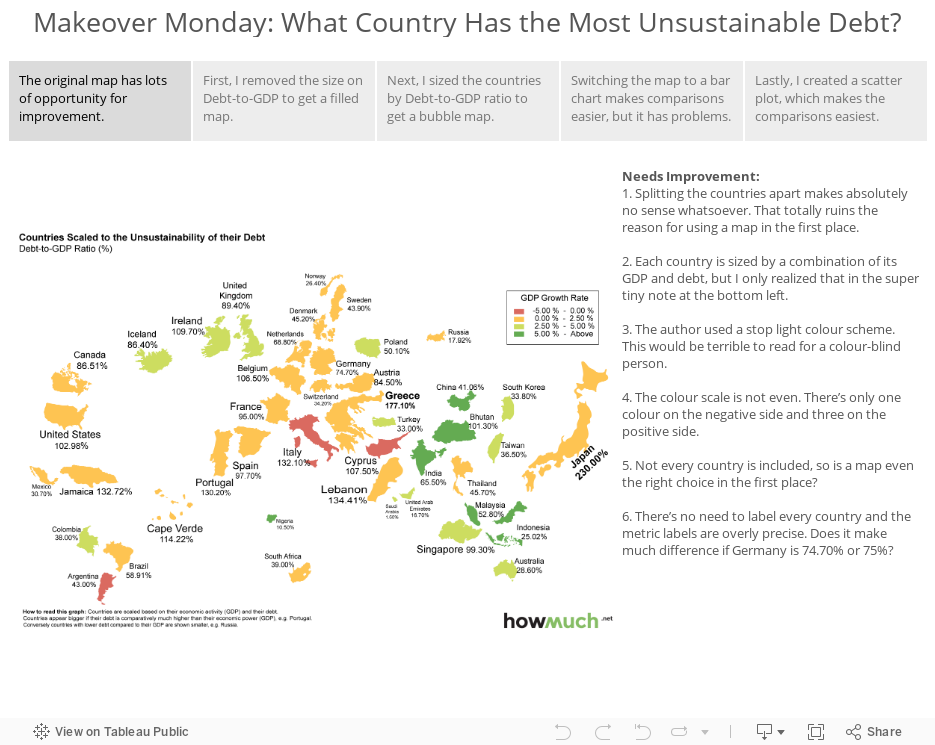
Makeover Monday: What Country Has the Most Unsustainable Debt?
country
,
debt
,
gdp
,
howmuch.net
,
Makeover Monday
,
map
2 comments
Consider a scale of 1-10: 1 is a great viz, 10 is terrible. The visualisation I’m choosing to makeover this week is about a 15. It’s THAT bad. Here goes:


Let’s take a look at what they’ve done poorly:
Given the above challenges, I’ve used Tableau story points to walk you through the makeover. In the story, I take you through a series of visualisations that gradually improve the original.
Let’s take a look at what they’ve done poorly:
- Splitting the countries apart makes absolutely no sense whatsoever. That totally ruins the reason for using a map in the first place.
To Do: Put the map back together and let the map serve its purpose. - Each country is sized by a combination of its GDP and debt, but I only realized that in the super tiny note at the bottom left.
To Do: Make the sizing more obvious and easier to understand. - The author used a stop light colour scheme. This would be terrible to read for a colour-blind person.
To Do: Change the colour scale to something more effective that appeals to everyone. - The colour scale is not even. There’s only one colour on the negative side and three on the positive side.
To Do: Make the ranges equivalent. - Not every country is included, so is a map even the right choice in the first place?
To Do: Consider alternative charts, e.g., bars. - There’s no need to label every country and the metric labels are overly precise. Does it make much difference if Germany is 74.70% or 75%?
To Do: Clean up the clutter.
Given the above challenges, I’ve used Tableau story points to walk you through the makeover. In the story, I take you through a series of visualisations that gradually improve the original.
November 15, 2015
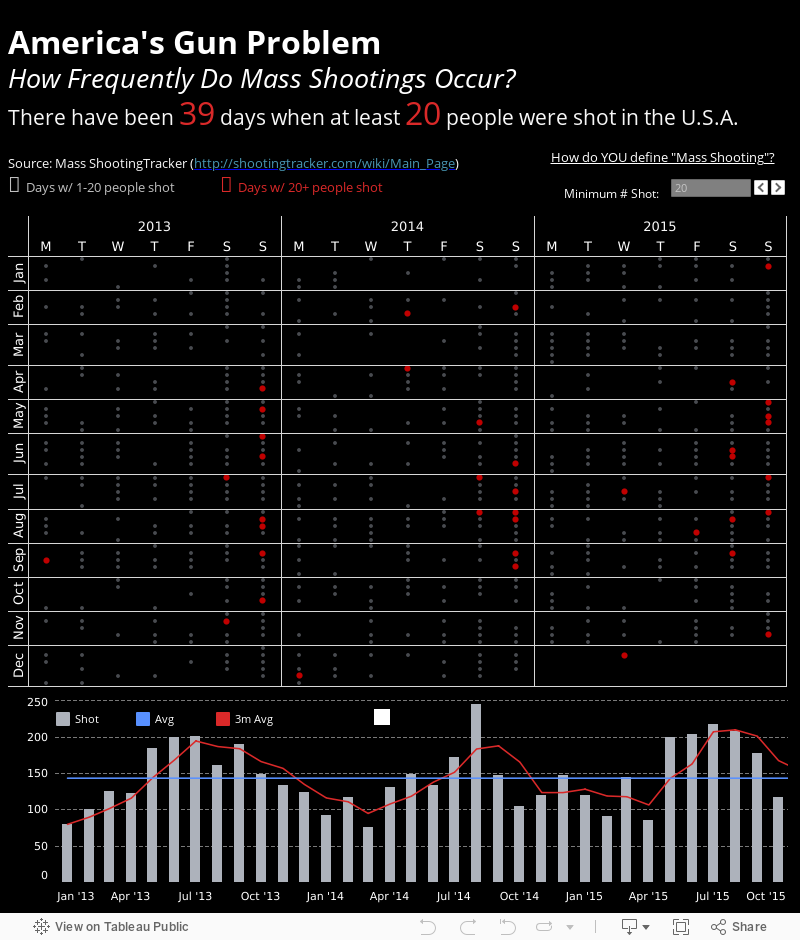
America's Gun Problem: How Frequently Do Mass Shootings Occur?

The terrorist attacks by ISIS are despicable, cowardly, sad. I can’t even begin to fathom what would make one human want to kill another. Needless to say, a solution is needed, and it won’t be easy.
But as I was checking on my friends in Paris, a question popped into my head: How often do the biggest of mass shootings occur in the United States? With that question in mind, I started by exploring the data with Vizable and shared the results on Twitter.

I knew there was a story to be told; I also wanted the people interacting with the story to create their own definition of mass shooting. So I opened the data in Tableau and started answering the question myself. I had a few goals:
To me, looking at the data this way shows the staggering numbers of shootings in the US.
But as I was checking on my friends in Paris, a question popped into my head: How often do the biggest of mass shootings occur in the United States? With that question in mind, I started by exploring the data with Vizable and shared the results on Twitter.
I knew there was a story to be told; I also wanted the people interacting with the story to create their own definition of mass shooting. So I opened the data in Tableau and started answering the question myself. I had a few goals:
- Show all of the days when people were shot
- Allow the user to create their own definition of mass shooting (I chose 10)
- Highlight the days that “qualified” as mass shootings
- Show the cyclical nature of shootings
To me, looking at the data this way shows the staggering numbers of shootings in the US.
November 13, 2015
Dear Data Two | Week 28: Smiling at Strangers
bar chart
,
color
,
Dear Data Two
,
line chart
,
sentiment
,
shapes
,
smile

I was really looking forward to this week! Anyone that knows me knows that I LOVE talking to strangers. My wife has quite a few good stories to tell about me making the odd conversation with someone I don’t know. Mostly what I enjoy is seeing people’s reactions. I find most people to be accepting, but there are times when I probably should keep my mouth shut.
For Dear Data Two, I had to track smiling at strangers only. Meaning COMPLETE strangers. I collected data based on the date, location, and how the person reacted.
Locations were then grouped into five situations:
I strictly recorded only one reaction/interaction per person:
The reactions were grouped by sentiment:
I did a lot of exploration of the data in Tableau, which you can see by clicking on the image below. The most notable finding was how friendly people were while traveling. This surprised me because I assumed travel correlates with stress; I’m glad to know I’m wrong.
Overall, a super enjoyable week for me. I’m interested to see Jeffrey’s take on this topic. I think he’s a bit more introverted than me.

For Dear Data Two, I had to track smiling at strangers only. Meaning COMPLETE strangers. I collected data based on the date, location, and how the person reacted.
Locations were then grouped into five situations:
- Traveling
- Coffee & Food
- Leisure Activities
- Shopping
- Work
I strictly recorded only one reaction/interaction per person:
- Smiled back
- Smiled at me first
- Didn’t notice me
- Looked away
- Pretended they didn’t notice me
The reactions were grouped by sentiment:
- Positive = Smiled back & Smiled at me first
- Neutral = Didn’t notice me
- Negative = Looked away & Pretended they didn’t notice me
I did a lot of exploration of the data in Tableau, which you can see by clicking on the image below. The most notable finding was how friendly people were while traveling. This surprised me because I assumed travel correlates with stress; I’m glad to know I’m wrong.
Overall, a super enjoyable week for me. I’m interested to see Jeffrey’s take on this topic. I think he’s a bit more introverted than me.
Coming to NYC: Coffee Talk with Tableau Zens

Like coffee? Love Tableau? Live near NYC? Then we have just the event for you.
On Friday, November 20th from 8-11am, grab a coffee, have a seat and chat about the world of Tableau and data visualization with three Tableau Zen Masters: Peter Gilks, Steve Wexler and me (Andy Kriebel).
Pop in at any time. If 8am is best for you, show up then. If 10:23 is better, come then.
This is intentionally informal, so you should feel free to ask us anything. Our goal is to meet as many of you as possible. We hope to see you there!
While you don't need to sign up, it would be nice to know if you plan to come. I've created a Facebook event here.
Event Details
Date: Friday, November 20th
Time: 8-11am (pop in any time)
Location: Jams NYC (1414 Avenue of the Americas, New York, NY 10019)
November 11, 2015
Dear Data Two | Week 27: Media

Data collection for week 27 was simpler than most, and I’m quite thankful for that since I forgot to track the data as I prepared for talks in Cincinnati and Vegas. I looked retroactively at my history on the apps & websites on which I consume stories and articles. I only counted articles that I actually read and not just skimmed over. I did not count the content on Facebook that you see, but don’t click on.
From there, I did some quick analysis in Tableau to understand the data before creating the postcard.
When I went into the project for this week, I fully expected Facebook to dominate other consumption methods. Yet to my great surprise, Feedly was far and away my preferred method for consuming stories. I’m not exactly sure why this is, surely it has something to do with the design of their product. In Feedly, I choose the content I want to follow, so it’s much more likely to be of interest to me. Whereas Facebook tends to be a lot of noise and little signal as far as stories and articles are concerned. I don’t look at my LinkedIn and Twitter timelines often, so it’s no surprise that those as so low.
The inspiration for the postcard came from Giorgia’s week 13 postcard about her desires. I wanted to use stars like she did, but I couldn’t find a stencil to use. I went with hexagons instead.
November 10, 2015
Tableau Tip Tuesday: Background Images, Customizing Object Locations & Images Inside Donuts
annotations
,
background image
,
donut chart
,
shapes
,
Tableau Tip Tuesday
,
tips
,
tricks
6 comments

The video covers:
- How to add a background image
- How to create donut charts with an image in the middle
- How to use point annotations to find the precise locations for placing objects
I hope you enjoy the tips; it was a lot of fun making this viz. Click here to see my write up for the Dear Data Two project.

November 9, 2015
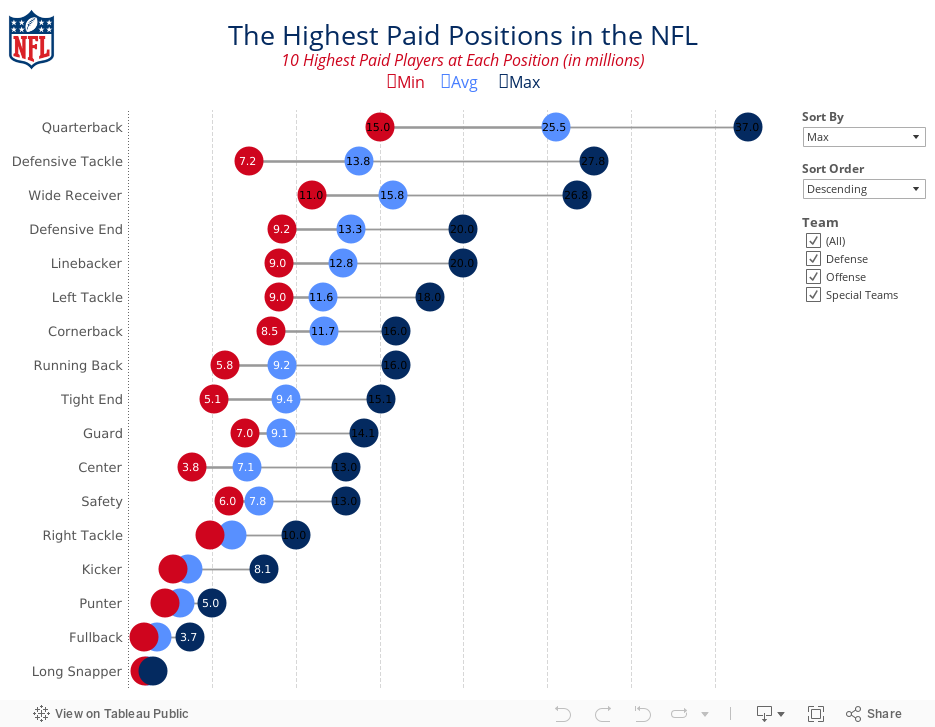
Makeover Monday: The Highest Paid Positions in the NFL
Chart of the Day
,
Cork Gaines
,
distribution
,
DNA chart
,
dot plot
,
football
,
Makeover Monday
,
nfl
,
sports chart of the day
2 comments

Today was a perfect day to practice the “time-boxing” technique I use for makeovers. I worked on this as I headed to Northampton to teach a Tableau Fundamentals course for a customer. The train journey from Euston to Northampton is 57 minutes, and I completed this makeover in 42 minutes.
Ok, here we go. First, the chart to makeover today was by Cork Gaines of Business Insider.

I really like the idea behind this chart: understanding the salary distribution of NFL players by position. However, there are a few problems with this chart:
To address these concerns, I’ve created the viz below. In my version, I’ve made the following changes:
This was a pretty simple and quick makeover that I feel provides a much more meaningful and insightful visualisation.
Ok, here we go. First, the chart to makeover today was by Cork Gaines of Business Insider.
I really like the idea behind this chart: understanding the salary distribution of NFL players by position. However, there are a few problems with this chart:
- The labels are vertical, making them harder than necessary to read.
- It took me a while to understand the sorting; the chart appears to be sorted by average salary.
- The salaries are only for the top 10 in each position, which means the min, avg and max are all relative to those 10 players.
- The labelling feels like it’s cluttering the chart.
To address these concerns, I’ve created the viz below. In my version, I’ve made the following changes:
- Changed the labels to horizontal
- Added options for sorting the viz by any of the metrics and allowing the user to pick a sort order
- Added a filter for the team the position belongs to
- Changed the chart from a bar chart to a dot plot/DNA chart
- Moved the labels into the middle of the dots, where they fit, and removed the $ symbols
- Changed the colours to use the offical NFL colours
This was a pretty simple and quick makeover that I feel provides a much more meaningful and insightful visualisation.
November 6, 2015
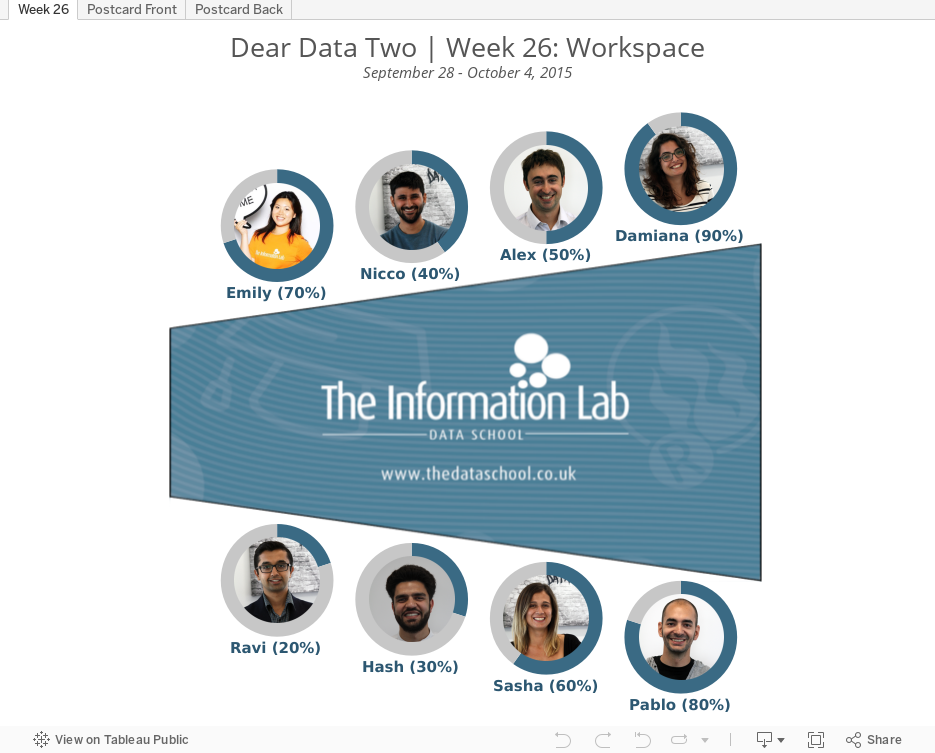
Dear Data Two | Week 26: Workspace

After a hiatus to get ready for our talk at #DATA15, I’m now several weeks behind and playing a game of catchup again.
The topic for week 26 was workspace and my first thought turned to the Data School and the consultants I get to train every day. To say some of them are creatures of habit would be a massive understatement. Just a week into their training, they were sitting in the same spots every day, so I made them start rotating places. Some took well to this and others (ahem Damiana) insisted on maintaining their spot, even occassionally threatening the coach.
They also have a great affection for donuts. Most Fridays I bring them a sugar filled breakfast. Little do they know that I’ve been tracking their seating and donut eating habits during their time with me. Naturally, since this week is about them, I decided to create donut charts with their pictures in the middle to show how often they sit in their favorite spot.
This was a fun process that I’ll detail in another blog post next week as a Tableau Tip.
Creating the postcard turned out to be an absolute pain! First, I had the table backwards, so I ripped that card up. Second try, the colours I chose for the donuts didn’t work, so I ripped up that card. Finally, I got the card completed, pasted on their little pictures, only to realize I had the table backwards again. I decided to heck with it; good enough is good enough and this project is about learning from the mistakes we make along the way anyway.
Lastly, I added little chocolate donuts under each picture to show how many they typically eat.
November 3, 2015
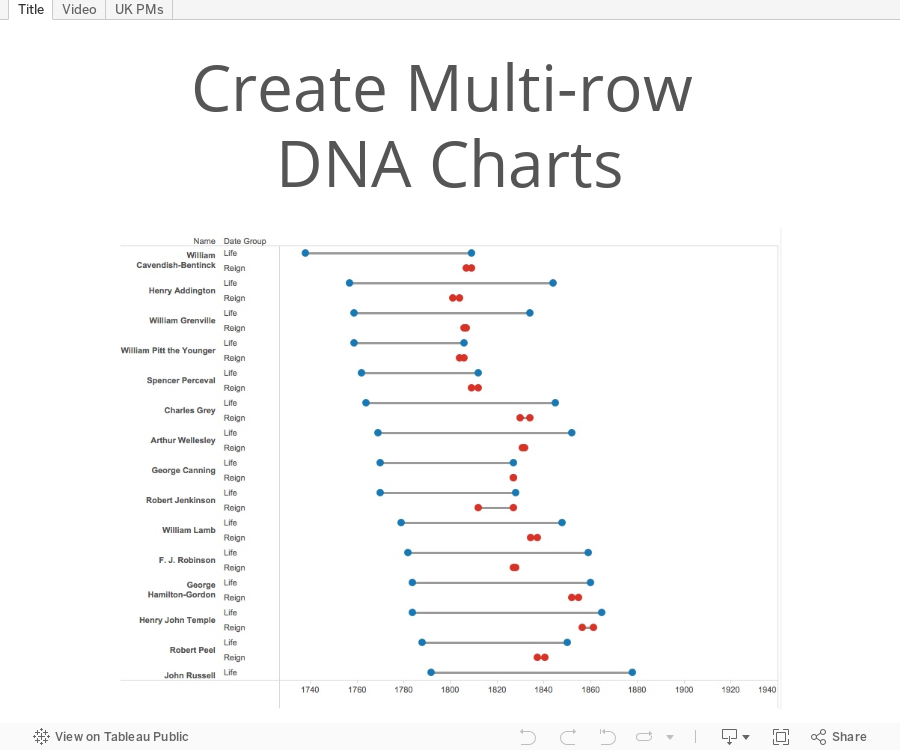
Tableau Tip Tuesday: How to Create Multi-row DNA Charts

Several weeks ago, Alex Gimson of Import.io reached out to me asking how to create multi-row DNA charts. Ultimately, he wanted two rows for each UK Prime Minister: one to represent the length of their life and a second row to represent the length of their term as PM.
This was pretty straightforward, but required using the pivoting capabilities in the connection window.
This was pretty straightforward, but required using the pivoting capabilities in the connection window.
November 2, 2015
Makeover Monday: The History of Scoring and Length of Games in Major League Baseball
Alberto Cairo
,
baseball
,
Chart of the Day
,
connected scatterplot
,
Cork Gaines
,
sports chart of the day
,
time series
No comments

Today marks the end of my two week hiatus from makeovers. #Data15 was absolutely amazing and then I had a great family holiday in Copenhagen to help me detox from Vegas.
This week, I’m taking a look at this chart from Sports Chart of the Day. In the article, Cork Gaines states:
I’d love your feedback on my approach to the makeover using story points and also how I constructed the connected scatterplot. Does it do a better job of telling the story?
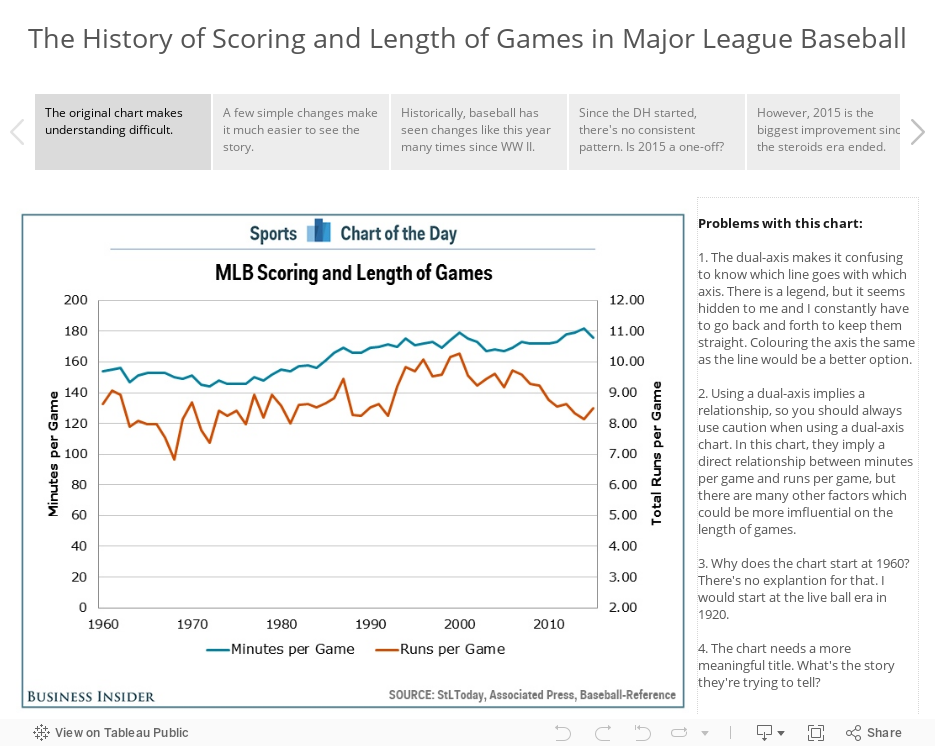
This week, I’m taking a look at this chart from Sports Chart of the Day. In the article, Cork Gaines states:
"It is just one season, but the first year under commissioner Rob Manfred would have to be considered a resounding success as two of the league's most troubling trends are now once again moving in a better direction."This is great, but the accompanying chart implies that a one year change makes a trend. For the makeover, I’m using story points to:
- Show what’s wrong with the chart
- Show a better version of the same chart
- Show an alternative view that debunks Cork’s implication
- Use a connected scatterplot in the vain of those praised by Alberto Cairo to tell the story of runs per game versus length of game from 1920 to 2015.
I’d love your feedback on my approach to the makeover using story points and also how I constructed the connected scatterplot. Does it do a better job of telling the story?
Subscribe to:
Posts
(
Atom
)


