November 13, 2015
Dear Data Two | Week 28: Smiling at Strangers

For Dear Data Two, I had to track smiling at strangers only. Meaning COMPLETE strangers. I collected data based on the date, location, and how the person reacted.
Locations were then grouped into five situations:
- Traveling
- Coffee & Food
- Leisure Activities
- Shopping
- Work
I strictly recorded only one reaction/interaction per person:
- Smiled back
- Smiled at me first
- Didn’t notice me
- Looked away
- Pretended they didn’t notice me
The reactions were grouped by sentiment:
- Positive = Smiled back & Smiled at me first
- Neutral = Didn’t notice me
- Negative = Looked away & Pretended they didn’t notice me
I did a lot of exploration of the data in Tableau, which you can see by clicking on the image below. The most notable finding was how friendly people were while traveling. This surprised me because I assumed travel correlates with stress; I’m glad to know I’m wrong.
Overall, a super enjoyable week for me. I’m interested to see Jeffrey’s take on this topic. I think he’s a bit more introverted than me.

November 17, 2014
Makeover Monday: The Facebook Election

There are several things about this infographic that I don't like:
- The title doesn't tell us what the graphic is about.
- The pie charts; simply too many of them making comparisons difficult.
- There's no apparent order to the candidates.
- Candidate names are in ALL CAPS...why?
- The label for the Democrats section is off to the right, why?
- Some of the pies add up to less than 100% and some to more than 100%.
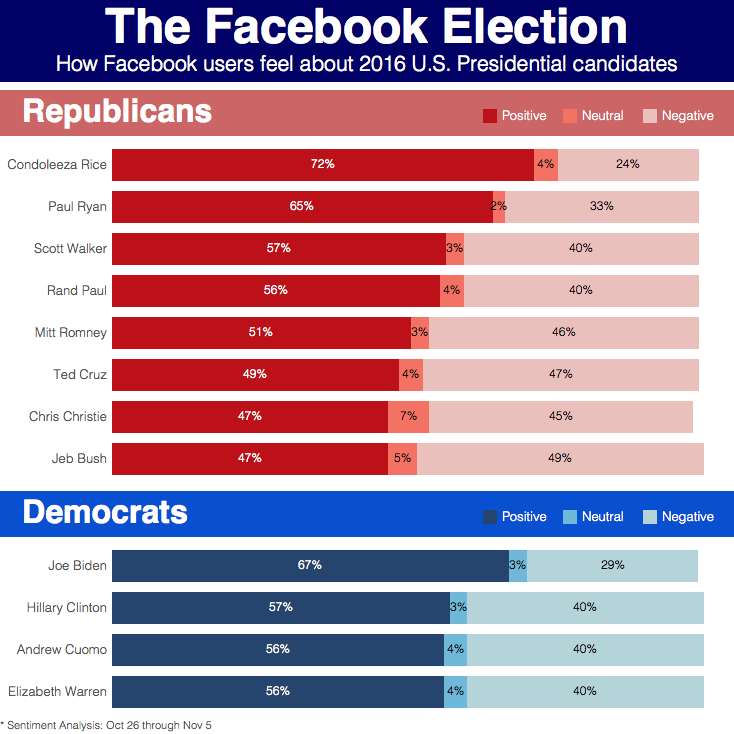
- The title makes it more clear what you're looking at.
- I switched the pie charts to stacked bars.
- The candidates are ordered by positive sentiment.
- The candidates names are easier to read since they're in proper case.
- The labeling for the two sections is aligned.
- Since I'm using stacked bars, the fact that some of the candidates are not equal to 100% is irrelevant.
February 25, 2013
Nielsen Makeover: Global recession sentiment chart alternatives
Nielsen recently published a report on economic recession sentiment, which included this summary chart:

At first glance, you might think “This is simple enough, how could Nielsen screw this one up?” Fortunately for me, they continue to make a mess of even the simplest charts.
This chart makes North America and Europe negative sentiment look so much higher than any other region or the global average. However, that’s only because the scale does not start at zero, nor do they call that fact out. Look at Latin America. Since when is 53% about 1/4 of 75%?
I wanted to see how far off their chart was so I built a simple bar chart in Tableau as a first alternative.

This is a very different perspective. Europe, Middle East/Africa and North America are all pretty close. And the change by quarter does not look nearly as severe.
A simple bar chart is an effective way to present this data, and there are other alternatives that work as well. Let’s consider two slope graphs.
The technique used to build these slope charts is very similar to the one I outlined in my previous blog post. Notice that the lines are colored by whether the sentiment increased (got worse) or decreased (got better). For this coloring, I used a technique recommended by reader Santiago Restrepo in which we calculate the quarterly change as a discrete measure.
First, you need to create a calculated field:

By default, the table calculate is set to compute along the Table (Across). For the slope graphs, we want the calculation to calculate by Quarter. To do so, click on the Default Table Calculation link on the Calculated Field window and choose Quarter.

The first slope graph looks at all Regions together:

The second option splits out each region across the table.

Which of the three options do you prefer? The bar chart or maybe one of the slope graphs?
Do you want to build something to share? Download the data here and/or the Tableau workbook here and leave a comment with a link to your work.






