June 27, 2023
Blue vs. Green - What does it mean?

When I first started using #Tableau, I assumed that blue meant dimensions and green meant measures. They don’t.
Blue means Discrete
Green means Continuous
It took me a couple of years to get my head around this most foundational concept in Tableau.
Dimensions and measures are merely a way that Tableau organizes the data.
And if you only take away one thing from this video, this is it:
- Blue things GROUP your data
- Green things COUNT your data
- Dimensions SPLIT up the view
- Measures FILL the view
June 26, 2023
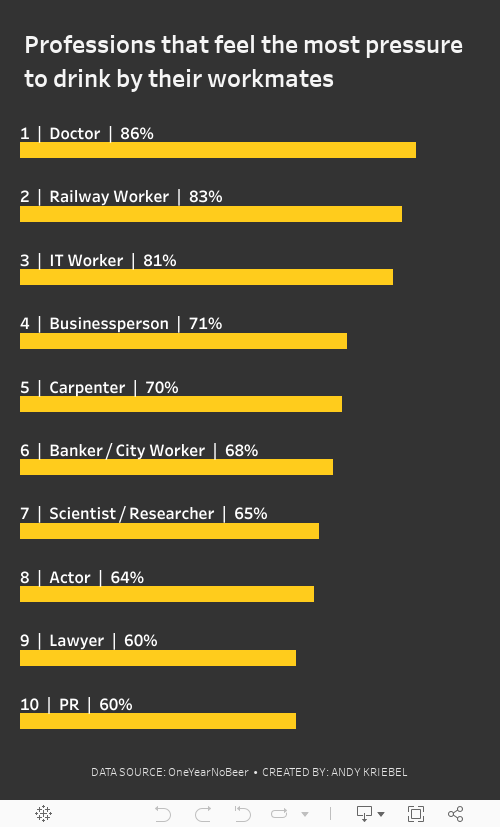
#MakeoverMonday 2023 Week 26: The UK's Drinking Culture

June 20, 2023
Tableau Tutorial for Beginners | Create Your First Dashboard

Learn how to use Tableau and created impressive dashboards.
Tableau is easy to use, but it can seem quite complex and confusing at first. The best way for you to learn Tableau is to download the files from the description of this video and follow along with me.
By the end of the video, you will have a much better understanding of Tableau and be confident that you can build dashboards on your own.
I'll take you step-by-step and show you how to create, publish and share your first interactive Tableau dashboard.
I'll cover:
- Tableau's welcome screen
- Connecting to data
- Making visuals
- Creating a dashboard
- Adding interactivity
- Publishing to Tableau Server
- Sharing with others
By the end of the video, you'll have created your first interactive Tableau dashboard which you can publish to the web or to your company's Tableau Server. I'll also show you how you can share your Tableau dashboard with others.
⏬ DOWNLOAD the data, and starter and solution workbooks here.
I would appreciate your support with a small donation to continue to make videos for you.
Sign up for my newsletter to get advance, exclusive viewing of all of my videos, tips for using Tableau, and exclusive discounts on products I create.
June 14, 2023
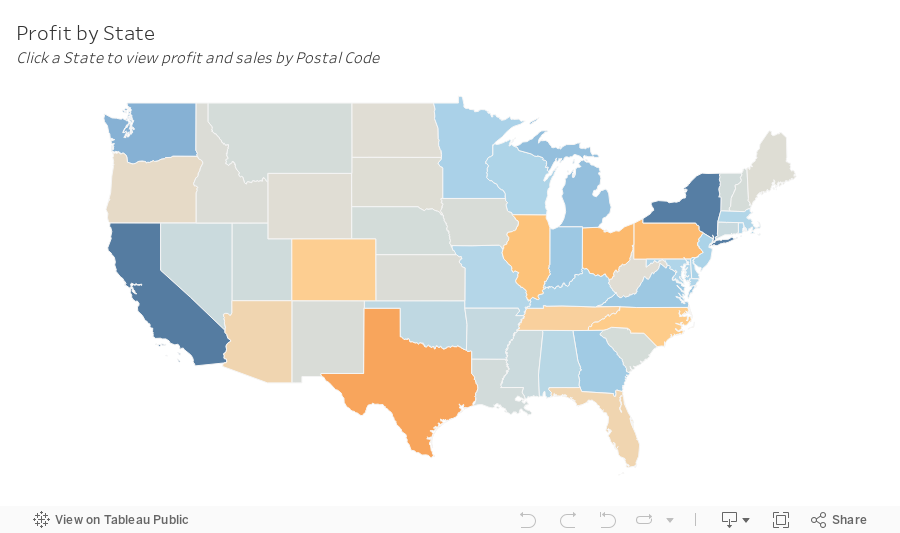
SIMPLE Map Drill Down in Tableau with Dynamic Zone Visibility

Creating a drill-down map in Tableau used to be more challenging than it needed to be.
But now, with the dynamic zone visibility, we can create a map drill down in just a couple of simple steps.
By signing up for my newsletter you get:
- Early access to tutorials
- New products
- Discounts
- Access to my new community Discord server
- Notification about any upcoming events and opportunities to learn
and more.
Sign up at andykriebel.com.
🆓 DOWNLOAD the data, plus a starter and completed workbooks:
https://andykriebel.gumroad.com/l/map-drill-down
🥁 See the viz in action:
June 12, 2023
#MakeoverMonday 2023 Week 24 - Cereal and the Green Revolution: Yields vs. Land Use

At the global level, how has crop production changed over the last fifty years?
In this Watch Me Viz live stream, I analyzed how the yield and land use of producing cereal has changed over the last 50 years.
I really liked the original visualization, so I rebuilt it in Tableau. I learned how to use dynamic zone visibility, layout containers, and more. Check it out.
Resources:
1. Data - https://data.world/makeovermonday/2023w24
2. Final Dashboard - https://tabsoft.co/3P3Sdl3
===============
Watch Me Viz is a weekly live stream where I help people become better at #Tableau, #PowerBI and data analysis. I show how I take an existing visualization, critique it, analyze the data, and build several visualizations all the while looking for a "better" visualization than the original.
If you are considering participating in Makeover Monday, you can get started by downloading data sets from the Makeover Monday website. I promise you'll become better at data analysis and data visualization by practicing every week.
Data sets - https://www.makeovermonday.co.uk/data/
===============
LEARN FROM ME
Join my newsletter. Sign up at andykriebel.com.
ARE YOU INTERVIEWING FOR A NEW JOB?
Contact me for more information about how I can help you prepare for that big interview.
===============
CONNECT WITH ME
More Watch Me Viz - https://bit.ly/WatchMeViz2023
June 6, 2023
Mastering TABLEAU Dashboards from Scratch

This comprehensive video will help you create business dashboards that are more actionable and meaningful and that your users will find easy to use at first glance. You’ll be on your way to being a dashboarding expert!
You’ll learn:
- Building basic charts
- Formatting fundamentals
- Using layout containers
- Dashboard formatting
- Essential tips for padding
- Filter controls
We'll create an interactive sales dashboard for Adidas in Tableau that's going to dynamically update based on the filters on the side of the dashboard which will allow us to select specific years, regions, products, and more.
⏬ DOWNLOAD my preferences file, the data, and starter and solution workbooks for £2 (this covers the costs of making this and future videos):
https://andykriebel.gumroad.com/l/adidassalesdashboard
Sign up for my newsletter to get advance, exclusive viewing of all of my videos, tips for using Tableau, plus exclusive discounts on products that I create.
https://andykriebel.com/


