June 26, 2023
#MakeoverMonday 2023 Week 26: The UK's Drinking Culture
bullet graph
,
combination chart
,
donut chart
,
drinking
,
floating
,
how to create
,
how to make
,
Makeover Monday
,
mobile
,
rounded bars
,
stacked bar chart
,
tableau
,
tip
,
tutorial
,
UK
No comments

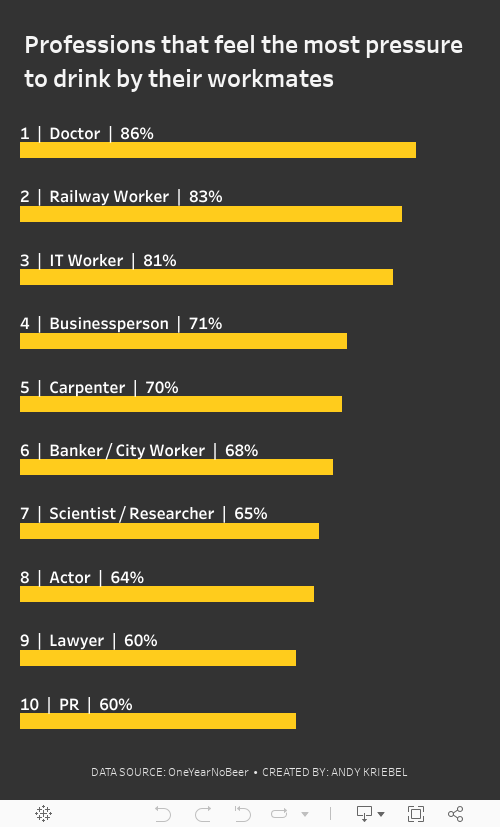
This week I delve into drinking, a topic that has long been integral to British culture.
We covered lots during the live stream. I started by attempting to recreate the original, but couldn't get it to work. I went on to build:
1. Stacked bars
2. Stacked bars with labels above the bars (there are a few neat tricks in this one)
3. Circle on a dotted line
4. Donut chart, bar chart combination chart
5. Bullet graphs
6. A mobile view that's a different sheet
Building the mobile view hopefully showed everyone how to leverage sizing objects in a dashboard. If you haven't watched, I created a 2nd sheet that I could format separately to fit on a mobile device. To the user, it would look like the same chart.
The trick is to float the 2nd sheet and make it 1x1 size. Because it's on the dashboard, you can then use the sheet in the mobile view. Check it out, you'll like it.
I'm pretty happy with where I got to in the end. Enjoy the live stream and check out the viz below or here.
Subscribe to:
Post Comments
(
Atom
)


No comments
Post a Comment