July 26, 2021
#MakeoverMonday 2021 Week 30 - America's Racial Breakdown by State
bar chart
,
color
,
ethnicity
,
filter
,
highlight action
,
Makeover Monday
,
race
,
state
,
tile map
,
treemap
,
United States
,
USA
No comments

Makeover Monday week 30 looked at this viz from Visual Capitalist showing the percentage of each race in each State in America.
In the video below, you'll see my recreate the tiled treemap before creating a tiled bar chart. Thanks for watching!
Click here to view the interactive version on Tableau Public.

July 21, 2021
How to Compare to the Prior N Months Using the IN Function
% difference
,
calculated field
,
change
,
comparison
,
datediff
,
datetrunc
,
function
,
IN
,
latest
,
level of detail
,
LOD
,
prior
,
prior 3 months
,
tableau
,
tip
No comments
Check out how we did this same exercise with a table calculation and a level of detail expression on Owen's blog here.

July 19, 2021
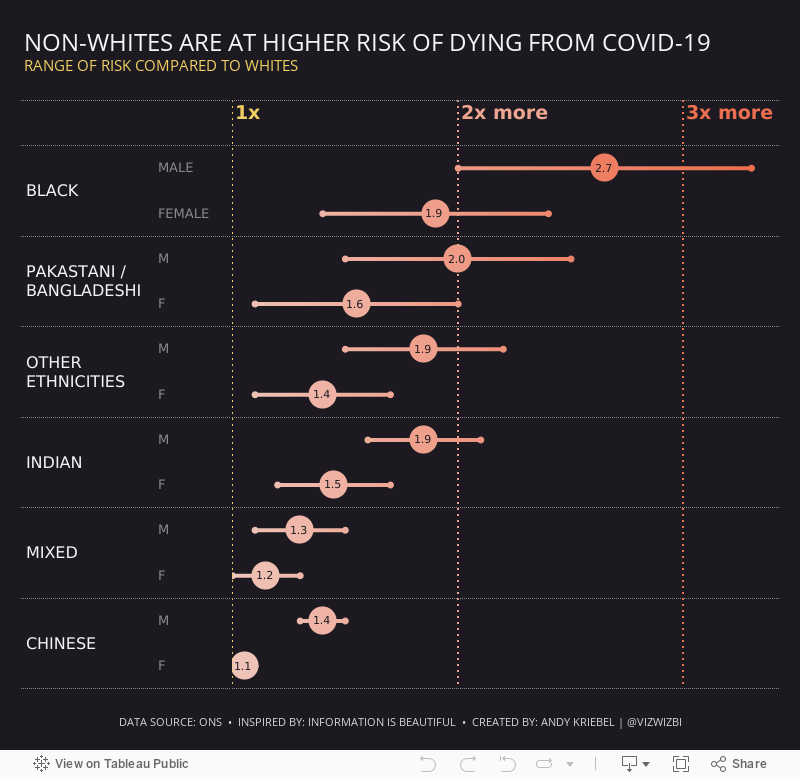
#MakeoverMonday 2021 Week 29 - Non-Whites Are At Higher Risk of Dying From COVID-19
chart
,
circle
,
color
,
color picker
,
connected
,
covid
,
custom sequential
,
formatting
,
graphs
,
Information is Beautiful
,
line
,
Makeover Monday
,
measure names
,
measure values
,
shape
,
tableau
No comments

Another COVID-19 data set this week and a great visualization that shows how much more likely ethnic minorities in the UK are to die from COVID.
In the video, I worked through rebuilding the original viz since I liked it so much. Interact with the viz below the video.
July 12, 2021
#MakeoverMonday 2021 Week 28 - COVID Vaccination Rates by Ethnicity and Age in England
age
,
area chart
,
color
,
combined axis
,
covid
,
dual axis
,
ethnicity
,
health
,
heat map
,
herd immunity
,
inequality
,
level of detail
,
line chart
,
LOD
,
Makeover Monday
,
race
,
rate
,
table calc
,
vaccine
,
wellness
No comments

I'm not sure what happened during the recording, but it got split into two parts. Both are below.
Resources:
1. Data Set - https://data.world/makeovermonday/2021w28
2. Original Viz - https://reports.opensafely.org/reports/vaccine-coverage/
Thanks for tuning in! Interact with the viz by clicking on the image below or here.
July 7, 2021
#WOW2021 Week 26 - Profitability With a Dual Axis Chart
analysis
,
calculated field
,
charts
,
color
,
dual axis
,
formatting
,
graphs
,
how to
,
level of detail
,
LOD
,
parento
,
table calculation
,
tableau
,
tip
,
tutorial
,
Workout Wednesday
,
WOW2021
No comments

Video and solution below...
July 6, 2021
How to Disable Sorting on a Worksheet
axis
,
disable
,
header
,
menu
,
show sort controls
,
sort
,
sorting
,
tableau
,
tip
,
worksheet
No comments
It's quite simple! All you have to do is turn off the sort controls. In this short Tableau Tip, I show you how to do it. Enjoy!

#MakeoverMonday Week 27 - If Only _____ Voted
biden
,
bump chart
,
Democrat
,
demographics
,
election
,
heatmap
,
Makeover Monday
,
republican
,
stacked bar chart
,
Trump
,
United States
,
USA
,
vote
,
voting
,
WatchMeViz
No comments

Resources:
1. Data Set - https://data.world/makeovermonday/2021w27
2. Original Viz - https://bit.ly/3qQGsAo
3. How to Create a Trellis Chart - https://www.vizwiz.com/2021/02/trellis-chart.html
4. The Data Visualisation Catalogue - https://datavizcatalogue.com/
The original was really good and I didn't particularly want to create a map. Instead, I wanted to visualize all of the demographics at the same time to see if any patterns emerged. I find them a bit hard to see in what I created, but when I know what I'm looking for (e.g., women vs. men) then the contrasts really stand out.
I create the heatmap the way I did for two reasons:
- To see across each metric in order to identify consistent blue or red patterns for an entire demographic (e.g., early voting or urban).
- To see if individual States always voted for Biden or Trump irrespective of the demographic (e.g., CA, MA, MD for Biden or KS, KY, LA for Trump).
There are parts of Watch Me Viz you can skip, like early on when I build some maps and try to join the data together (unsuccessfully) or when I change the data to Excel format.
Thanks for tuning in! Interact with the viz by clicking on the image below or here.
July 1, 2021
#WOW2021 Week 22 - Can You Structure the Unstructured?
bar chart
,
bins
,
calculated field
,
contains
,
filter
,
level of detail
,
map
,
reference line
,
regex
,
sys_numbin
,
tableau
,
Workout Wednesday
No comments
Week 22 was quite the tricky challenge. The idea itself is quite simple, but you had to (1) use REGEX to get the number of bedrooms (thanks to Sylvie Imbert at The Data School for her help!) and (2) know how to create bins without using the BIN function. Unless you've done it before, you likely will get quite stuck figuring out how to create the bins because it requires a hidden function...SYS_NUMBIN. I won't go into detail here; you can read more on Jeffrey Shaffer's blog here.
Check out how we did it by clicking on the image below.

Subscribe to:
Posts
(
Atom
)


