July 26, 2021
#MakeoverMonday 2021 Week 30 - America's Racial Breakdown by State

Makeover Monday week 30 looked at this viz from Visual Capitalist showing the percentage of each race in each State in America.
In the video below, you'll see my recreate the tiled treemap before creating a tiled bar chart. Thanks for watching!
Click here to view the interactive version on Tableau Public.

October 1, 2020
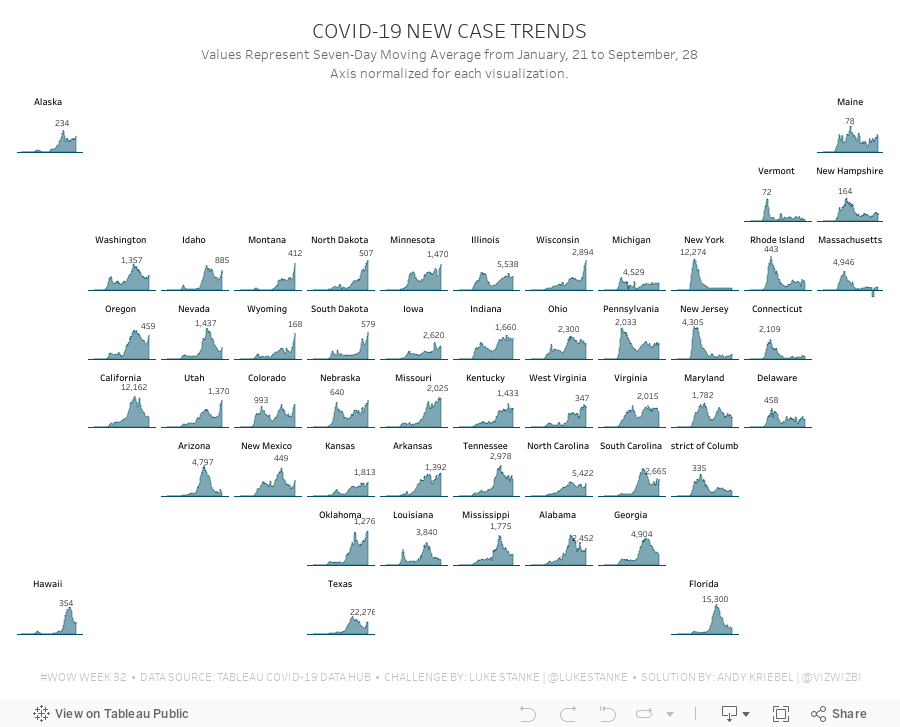
#WorkoutWednesday 2020 Week 32: COVID-19 New Case Trends

As I continue to catch up on Workout Wednesday challenges I've missed, I'm picking and choosing those that looking interesting at first glance (and that I think are doable in a short amount of time). Week 32 was one I knew I could get done quickly since it was very similar to 2017 week 7. Actually, since the columns and rows were provided to use already via a CASE statement, the trellis part of the exercise required no calculations and no work.
The toughest part was normalizing the calculation within each State. The key here is to think about each State individually, find the highest value, and then compare all of the other dates to that value. I did this by putting each State and date into a row, creating a calculation to get the largest value, then computing the necessary ratio. Once I had that, it was simple to turn it into a chart.
To get the State names in the middle of each chart, think about how you can count half of the day in each chart. Then take that value and add it to the first date and you'll get a single date that's halfway across the date range. This solution will be flexible for any new data that would be included.
Some difference between mine and Luke's
- I didn't filter the dates; I decided to use the entire data set, but keep in mind that I did this several weeks after Luke posted the challenge.
- I created a mobile version as well.
And with that, here's my completed #WorkoutWednesday for week 32 2020.
March 26, 2019
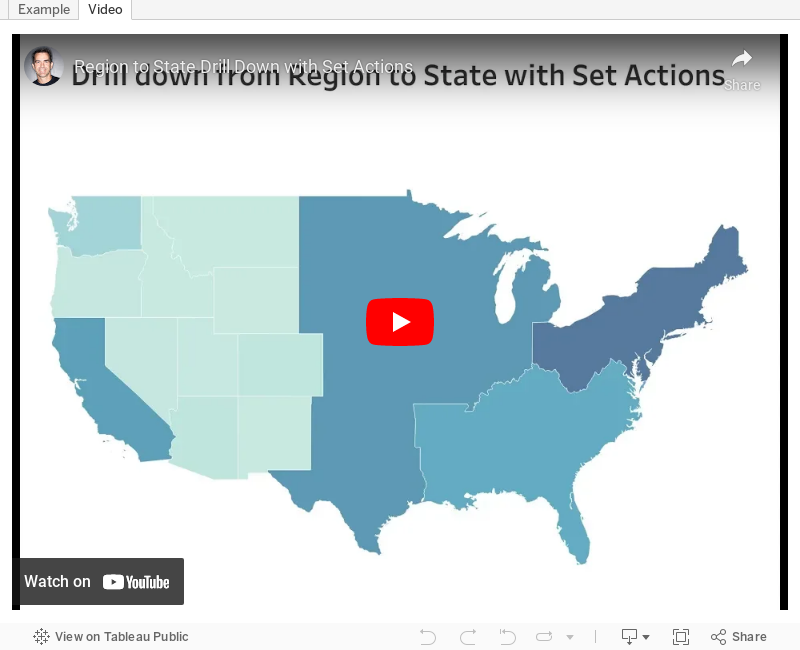
#TableauTipTuesday: Create a Region to State Drill Down Map with Set Actions

September 16, 2011
State Polygons in Tableau – A must have, useful, simple template
I recently read a post by Albatrosa Analytics that included a map of the continental US with the states shaded. I’ve see many people do this in the past, but the data set created by all of the points was HUGE. Now with the polygons feature of Tableau you can easily create a shaded map.
In the viz below, I’ve used the data blending feature to combine the polygons with data by state. I can see so many uses for this.
Download the data for creating the polygons here and the sample state data here.


