April 22, 2026
How to Make Your Worksheet Actions Work on a Dashboard

October 21, 2025
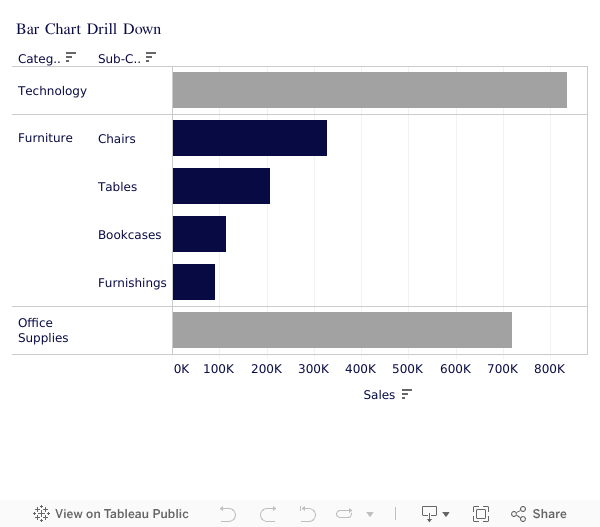
How to Drill Down in Tableau Using Set Actions (Bar Chart Tutorial)

Unlock Powerful Tableau Drill Downs With Set Actions 🔍
If you’re still clicking around dashboards trying to “fake” a drill down — stop! In this video, I’ll walk you step-by-step through how to use Set Actions in Tableau to build a fully interactive bar chart drill down.
👉 Start here to level up faster:
Tableau Starter Kit → https://www.nextleveltableau.com/starterkit
Core Concepts Course → https://www.nextleveltableau.com/tcc
Next-Level Tableau → https://www.nextleveltableau.com/
I’ve helped thousands of Tableau analysts move from frustration to clarity using features like this — and once you master Set Actions, your dashboards will finally work like your users expect them to.
📌 If you’re ready to stop confusing your users and start building cleaner, smarter dashboards… you’re in the right place.
See how it all works below the video.
July 28, 2020
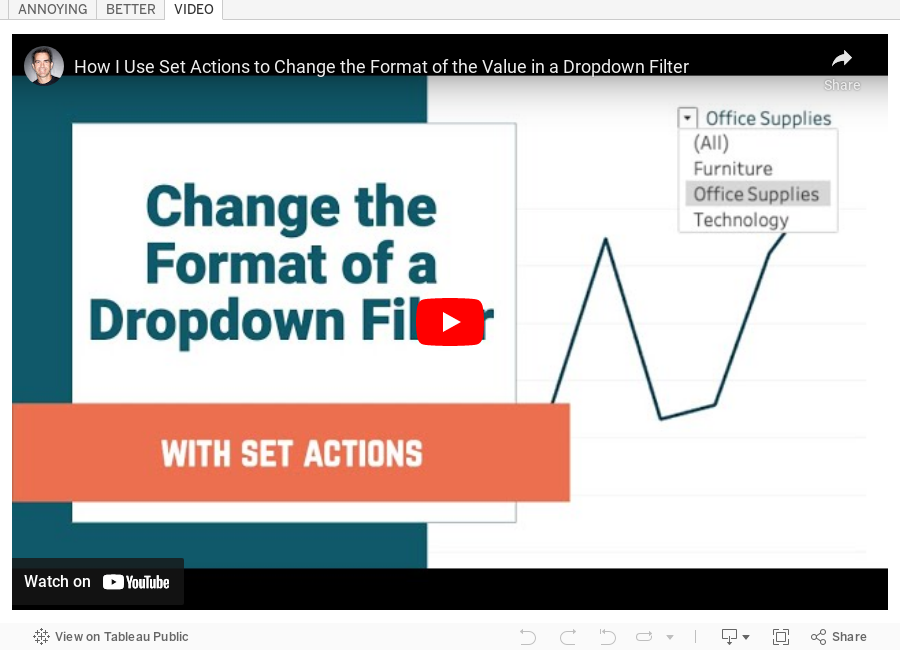
#TableauTipTuesday - Using Set Actions to Change the Format of the Selected Value in a Dropdown Filter or Parameter


- Using Category as a filter
- Using a Set Action so that the (All) option can also be displayed
June 2, 2020
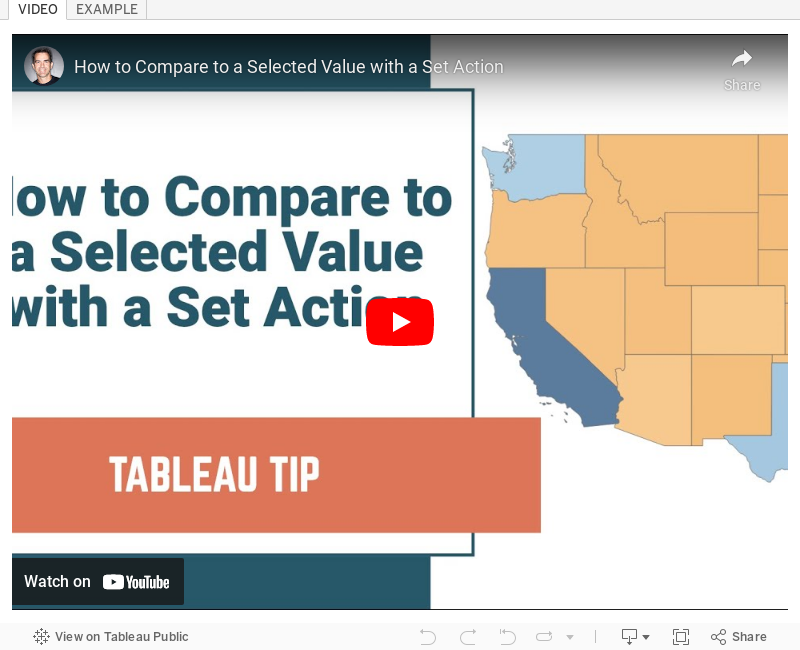
#TableauTipTuesday: How to Compare to a Selected Value with a Set Action

December 13, 2019
The Great Workbook of Table Calcs, LODs, and Actions

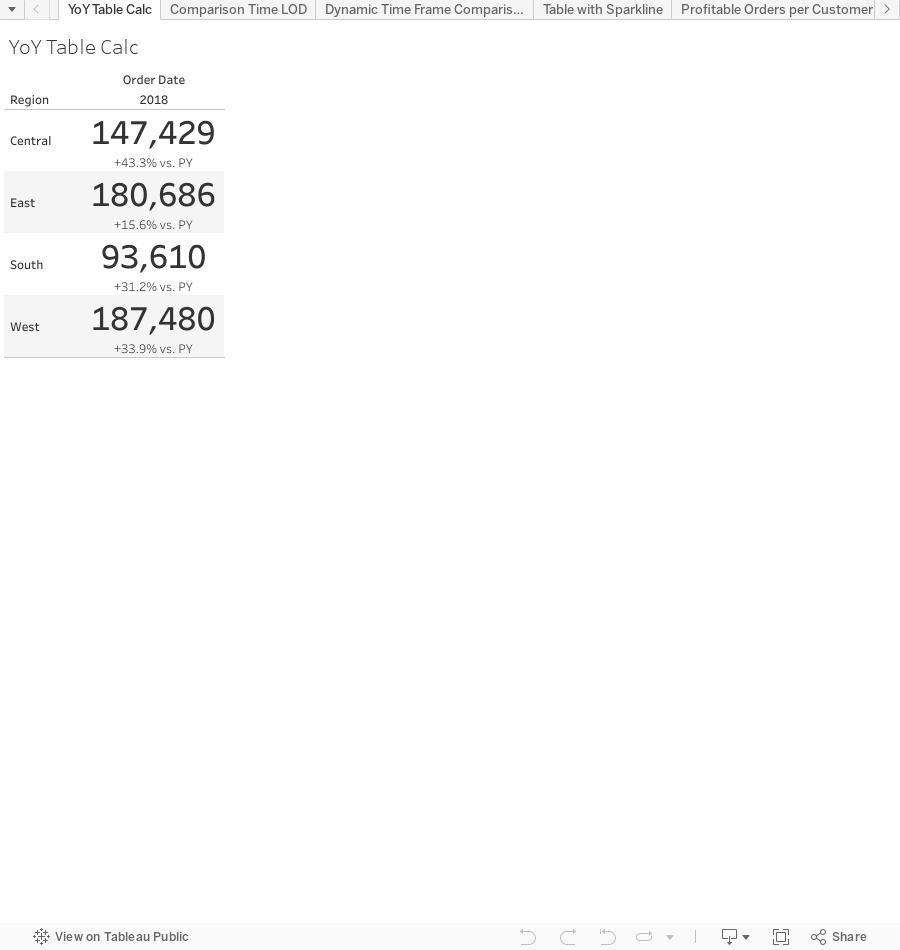
I've decided to share these with you, the Community, so that you can learn right along with the DSers. As of this writing, there are 61 examples in the workbook. As I add more, I'll re-publish the workbook.
You are welcome to use this in any way you please. However, please cite me as a source if you do; that's only fair. I would recommend you try to rebuild these examples before looking at the solution; you'll learn way more that way. The examples at the start of the workbook tend to be simpler, so start there and progress your way through. These aren't necessarily "perfect" solutions (there isn't a perfect solution), but they solve the puzzle we were seeking to solve.
And the name? It is inspired by the Big Book of Dashboards. I've always loved the name of that book! This workbook should be a good companion to the Tableau Visual Vocabulary I created in July 2018.
Enjoy! Now go learn!
November 19, 2019
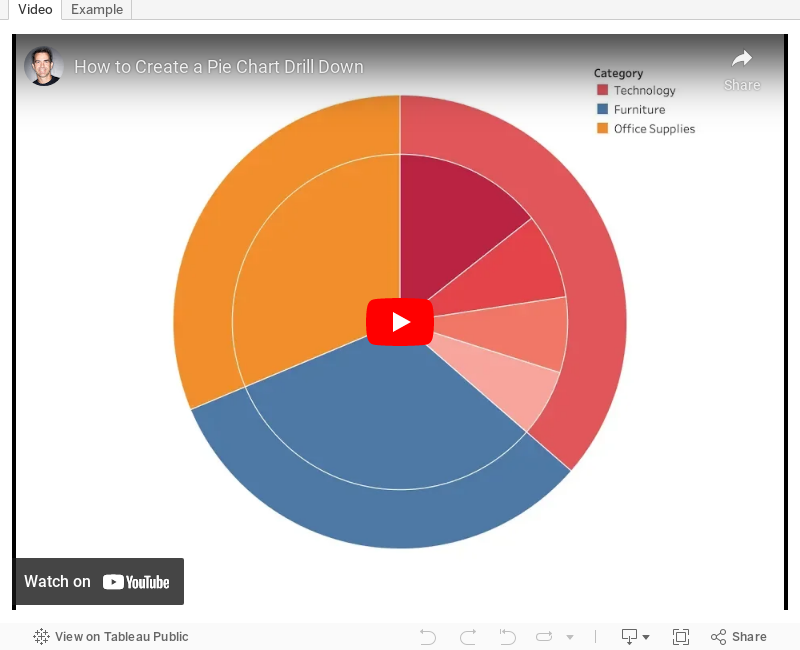
#TableauTipTuesday: How to Create a Pie Chart Drilldown

August 13, 2019
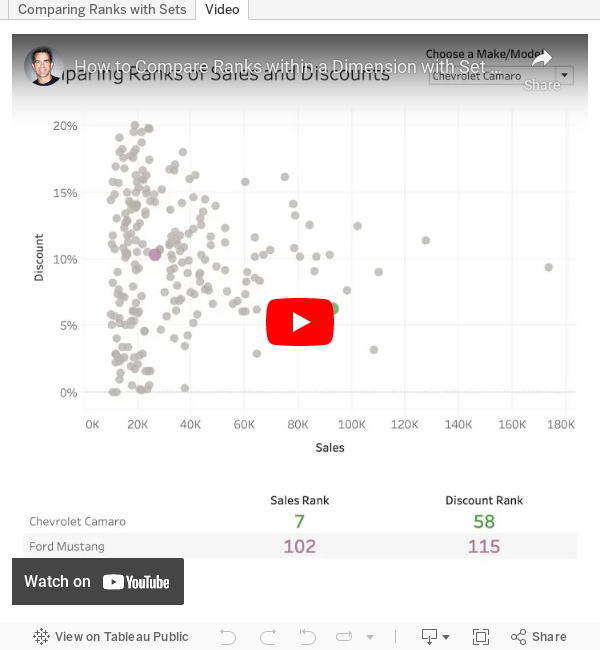
#TableauTipTuesday: How to Compare Ranks within a Dimension with Set Actions
And, when you display any players, you need to show their rank amongst everyone. This is where set actions come into play.
In this example, I show you how to compare any car to a car that you selected from a parameter. The car you select from the scatterplot appears next to the car selected from the parameter and the overall rank for each car is displayed.

May 21, 2019
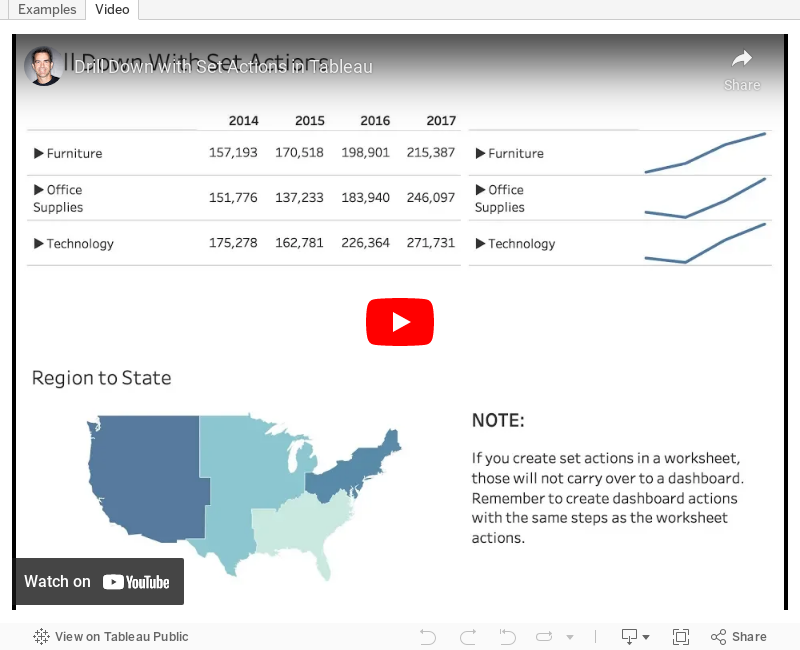
#TableauTipTuesday: Drill Down With Set Actions

Enjoy!
April 15, 2019
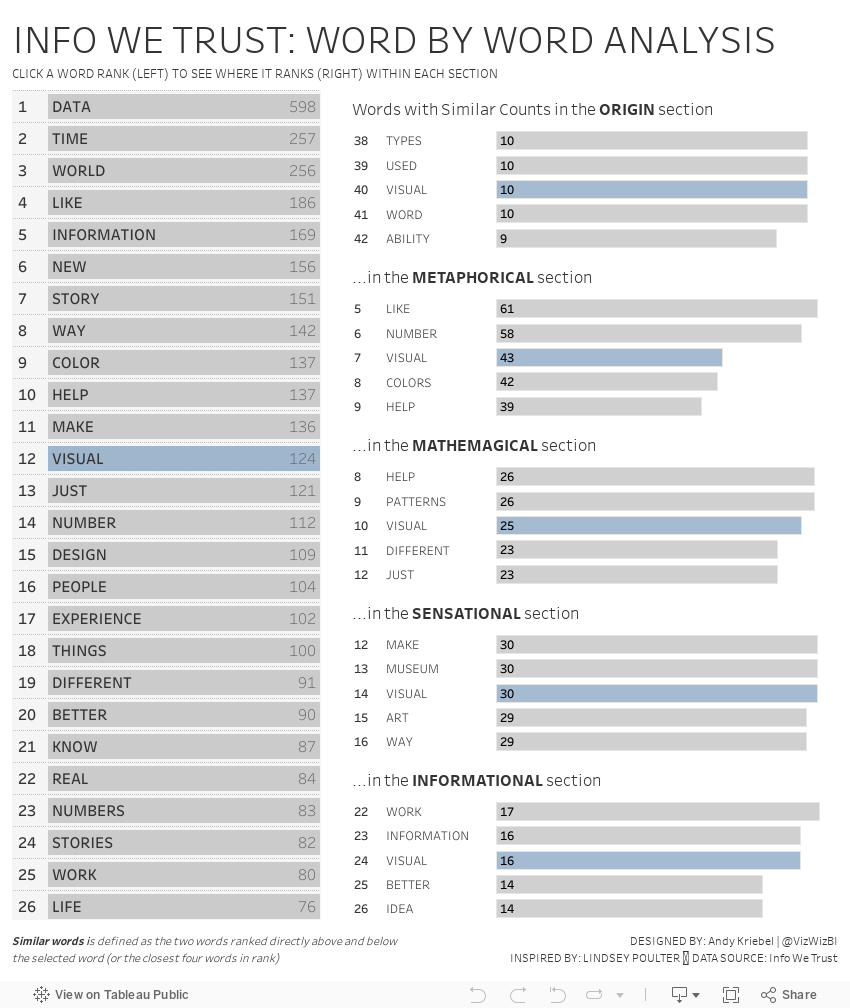
#MakeoverMonday: Info We Trust - Word by Word Analysis

UPDATE (19-Apr)
- Removed the sorting from the table on the right. When you click on a word, it now stays in its position rather than moving to the top.
- Made the titles of the bar charts on the right more succinct.
Week 16 is here and in collaboration with RJ Andrews, author of Info We Trust, we are making over a word cloud he created based on the frequency of the 270 most popular words in the book.

What works well?
- The most frequent words stand out because of their size.
- The word cloud looks interesting, meaning it captures your attention.
What could be improved?
- There are too many colors.
- The words are rotated in different directions.
- Sizing the words make it difficult to compare them and rank them.
- It's a book about data and the biggest word is data...go figure!
What I did
- We had been practicing set actions last week at The Data School, so I thought I'd replicate this dashboard by Lindsey Poulter.
- I wanted to rank the words and also rank the words within each section of the book.
- Create a mobile version based on the template Tableau builds for you automatically.
March 26, 2019
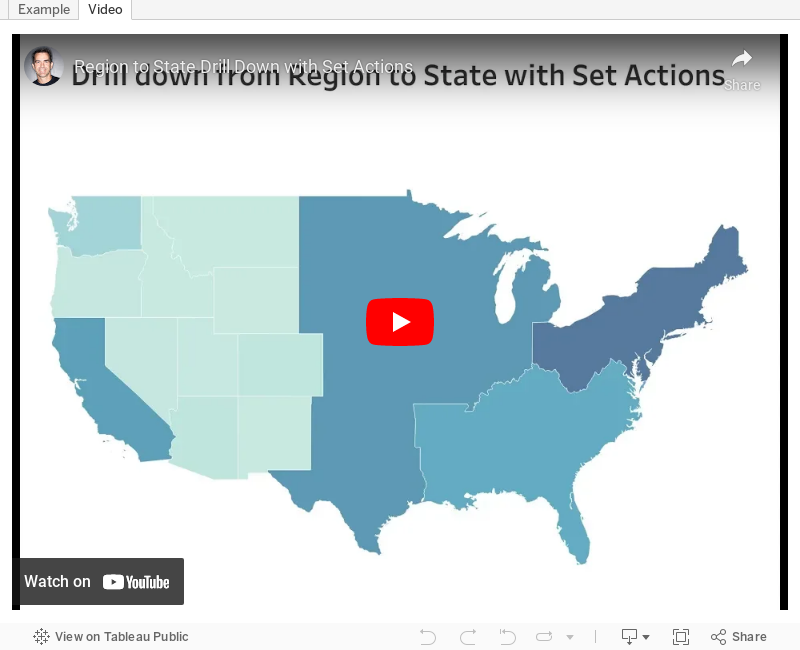
#TableauTipTuesday: Create a Region to State Drill Down Map with Set Actions

January 31, 2019
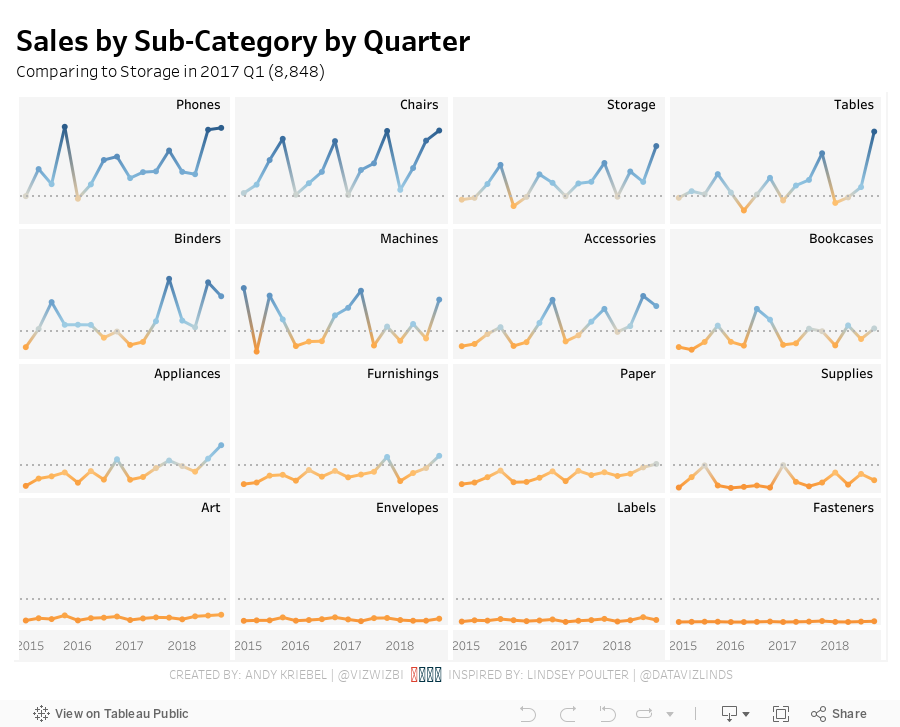
Set Actions: Dynamic Reference Lines and Coloring
Fortunately, we're surrounded by brilliant people at The Data School, so today Coach Carl asked Harry Cooney from DS11 (graduating tomorrow) to run a lesson for the team. Harry clearly understand them and walked us through several practical use cases to help us understand the basics. He then assigned each of us the task of recreating one of the vizzes from Lindsey Poulter's amazing resource of Set Action use cases. I was tasked with recreating her dynamic reference lines and colors viz.
I took on this challenge as I would a Workout Wednesday:
- Understand the requirements
- Play with the viz to see what it's doing
- Rebuild the viz
- Don't look at the method for the original until I'm done
- I built it all with one worksheet. Lindsey floated one sheet on top of another, meaning two sheets have to be maintained if changes need to be made.
- I labeled all of the sub-categories in the upper right of each box. Lindsey had it as a label for the last dot.
- I included tooltips and the x-axis.
- I added the circles directly on the line rather than as a separate chart. This allowed me to use the dual axis for labeling the sub-categories.

November 10, 2018
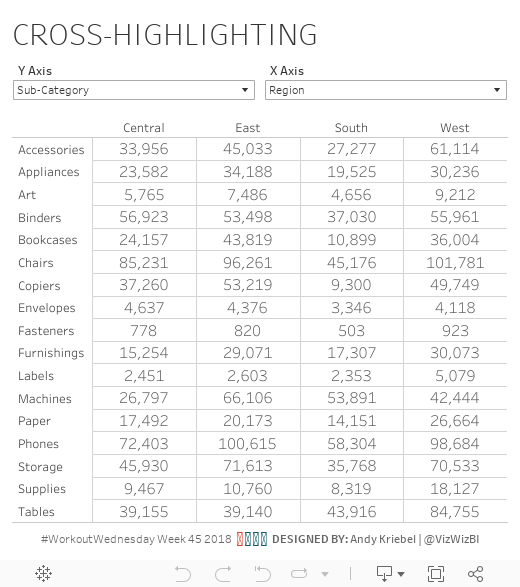
Workout Wednesday: Cross-Highlighting
The highlighter is very fickle. It seems you have to hover over a very specific spot to get it to work. I was able to make it work by using a boolean calculation, but the highlight set action was going crazy. So I went with Rody's technique of making it a continuous field so that it would actually stick.

November 3, 2018
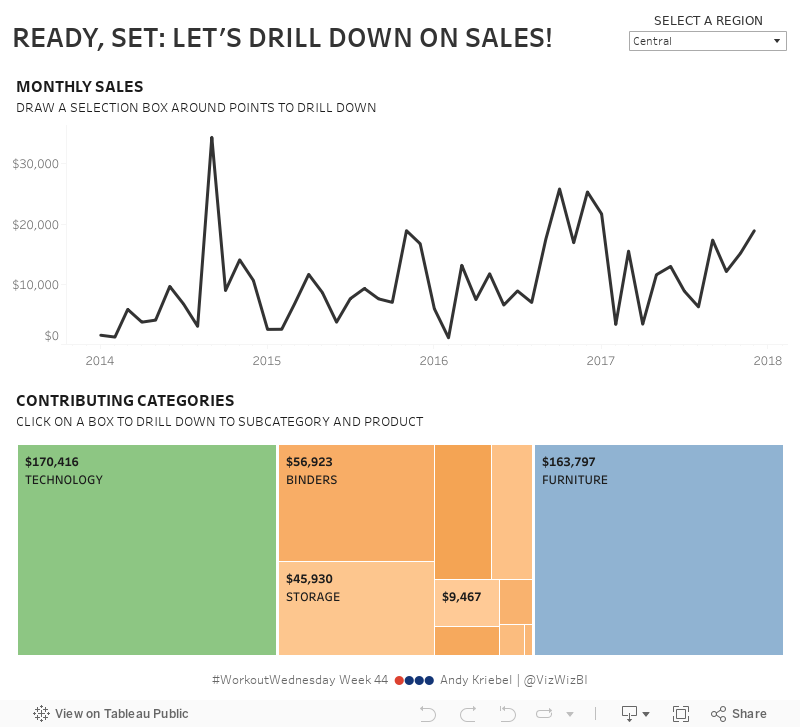
Workout Wednesday: Drill Down with Set Actions
Here are the basic requirements (full list here):
- Create a line chart of monthly sales that drills into the months you select
- Create a treemap of sales by category that has the ability to drill to sub-category and product name upon clicking
- When selecting months in the line chart, the treemap should also filter.
- Create dynamic labels (and tooltip) for the treemap that display based on the level of detail shown (category/sub-category/product name)