Showing posts with label show. Show all posts
December 20, 2024
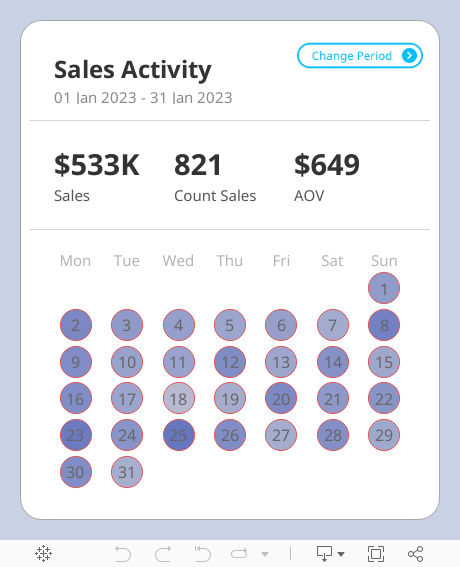
Create a Custom Calendar Widget
button
,
calendar
,
hide
,
parameter action
,
show
,
tableau
,
widget
No comments

Thanks Nicholas for providing me with the data set and setting an example of how simple visualization can communicate data effectively.
If you're not already following Nicholas, do so. You're guaranteed to find inspirational designs for your dashboards.
No extensions required. I think you'll love the trick I did with the title so that you can't click on it.
Downloading the workbook so that you can reverse engineer it is one of the best ways to learn.
May 20, 2021
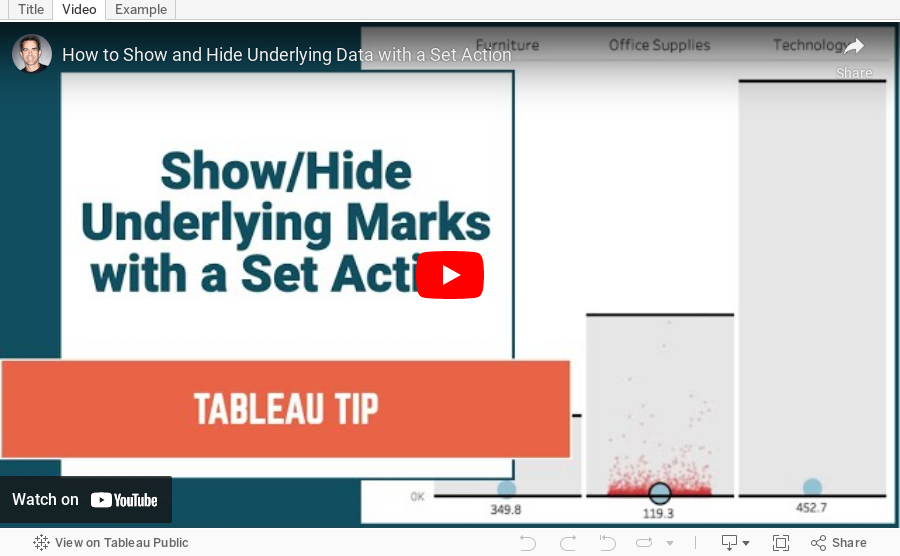
How to Show and Hide Underlying Data with a Set Action
calculated field
,
chart
,
comparison
,
context
,
distribution
,
dot plot
,
graph
,
hide
,
how to
,
jitter
,
random
,
reference band
,
set
,
set action
,
show
,
tableau
,
tip
,
tutorial
,
underlying data
No comments

I first saw this technique demonstrated by Lindsey Poulter; I've extended it to include jittering.
August 13, 2019
#TableauTipTuesday: How to Compare Ranks within a Dimension with Set Actions
combined set
,
hide
,
parameter
,
rank
,
set
,
set actions
,
show
,
Tableau Tip Tuesday
No comments
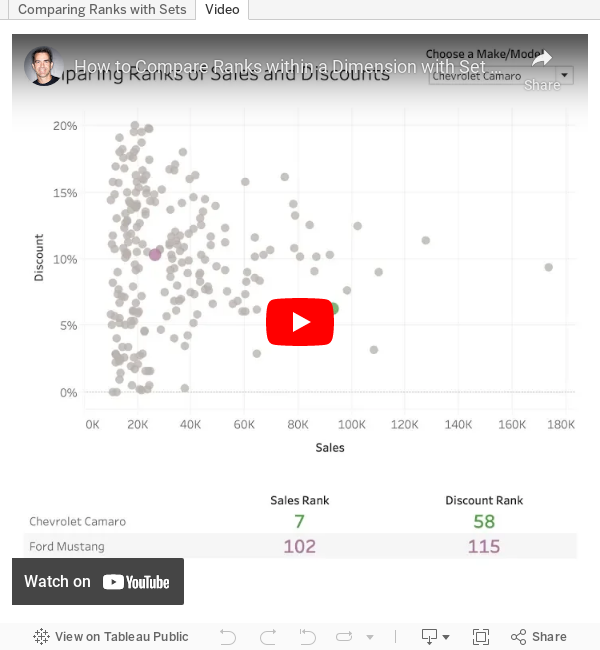
Have you ever needed to compare the rank of items, but only show two of them? For example, you want to show any player compared to Player A. Player A should always be in the view and another play should only be shown when selected.
And, when you display any players, you need to show their rank amongst everyone. This is where set actions come into play.
In this example, I show you how to compare any car to a car that you selected from a parameter. The car you select from the scatterplot appears next to the car selected from the parameter and the overall rank for each car is displayed.

And, when you display any players, you need to show their rank amongst everyone. This is where set actions come into play.
In this example, I show you how to compare any car to a car that you selected from a parameter. The car you select from the scatterplot appears next to the car selected from the parameter and the overall rank for each car is displayed.
May 3, 2017
Workout Wednesday: Appearing & Disappearing Charts
action
,
bar chart
,
Emma Whyte
,
exclude
,
filter
,
hide
,
icon
,
line chart
,
map
,
show
,
Workout Wednesday
3 comments
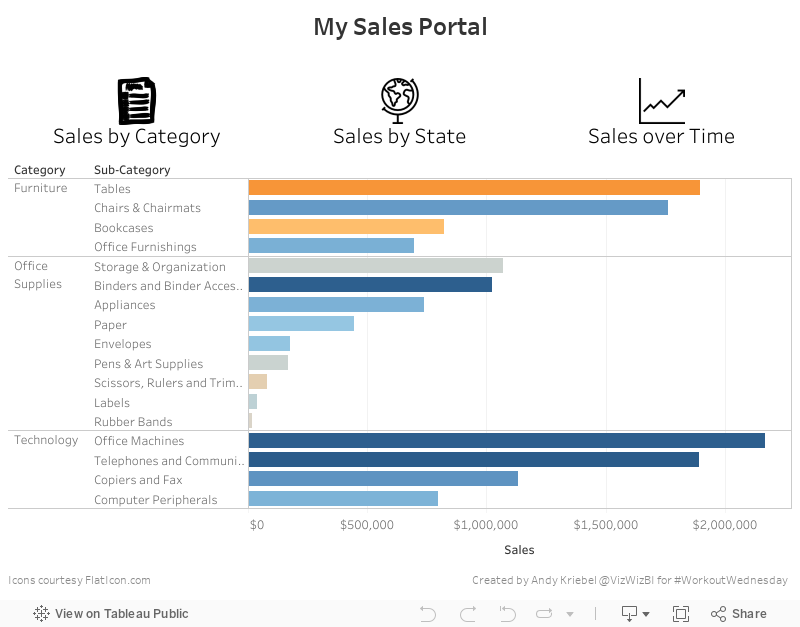
You can find the requirements over on Emma's blog. Here's my solution as a GIF:
The showing/hiding of the charts was pretty straightforward. My data doesn't match Emma's exactly despite using the same data source. I think maybe there's a join or data source filter on hers, but that's not really the point of this exercise. I also used different icons because I couldn't find the ones she used.
I won't give any hints as to how I did this so that you can do it on your own. I implemented this trick differently than Emma and both of our workbooks are downloadable if you care to have a look after you give it a try. Here's my Tableau dashboard.
November 29, 2014
Tableau Tip: Conditional Axis Formatting Using an Axis Selector
container
,
dashboard
,
hide
,
parameters
,
show
,
tableau
,
tips
,
tricks
3 comments
Back in July 2012, I wrote about "Dynamic Axis Selections". The problem with this approach, though, was that it created a single axis, which only allows for a single format. Reader Dave Andrade posted a different, yet related question in the comments.
Download the workbook here.
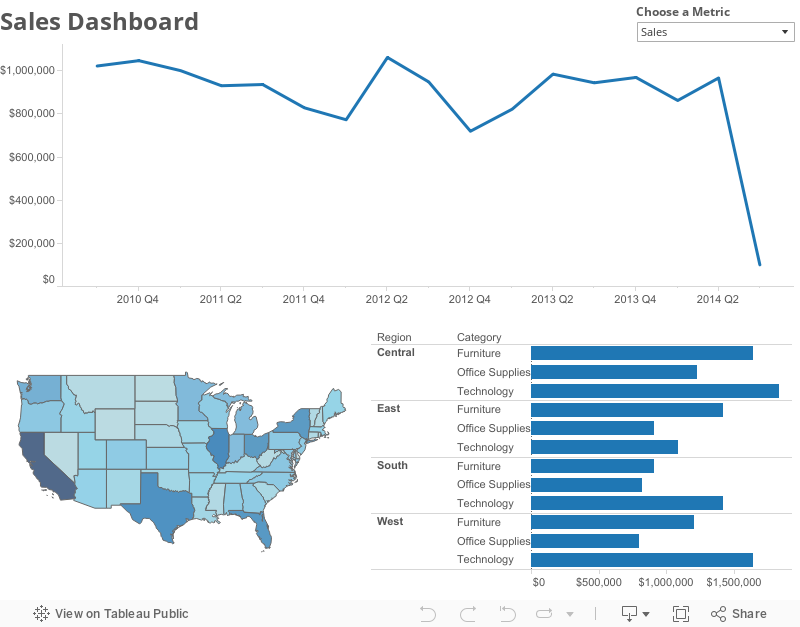
Let's say we choose 3 metrics - Mail Volume, Spend, and Response Rate as part of our parameter metrics. That means we now have a regular number, a dollar value, and a percentage as part of our available measures. After building the case statement and building a chart similar to the one you've shown in this post, the best thing we can do to show the correct values (sans label of $ or %) on the y-axis is using the "automatic" number formatting option for the 'Measure chosen' measure. I know Tableau has made it much easier to add the label on the chart itself with the Label mark after v8.0, but what about the actual y-axis value? Is there any way to dynamically update the measure value's axis label to reflect it's true number format?While the direct answer to Dave's question is no, there's isn't a way to dynamically update the format of the Measure Values pill, there is a work around using containers, which will can give the perception of conditional formatting. Here is the final output of the technique I've used. Read farther down for detailed step-by-step instructions, plus a video.
In this example, I've created a simple dashboard with three viz types: Line Chart, Map, and Bar Chart. I created three separate sheets for each type of chart, one for each metric: Sales, Profit Ratio, and Order Quantity, each having a different format for a total of nine worksheets.
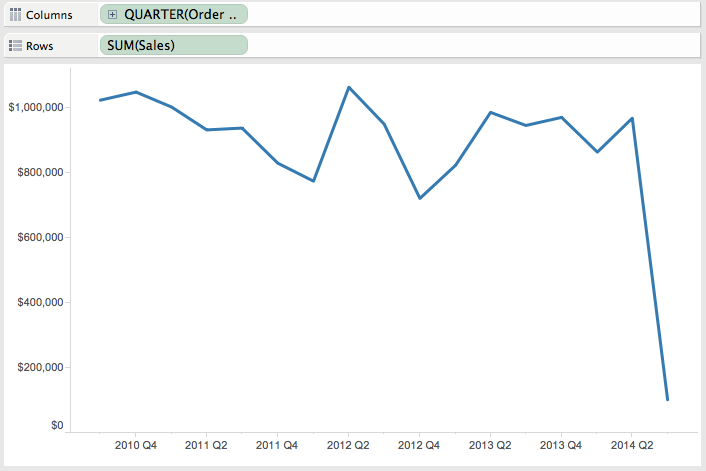
Step 1 - Create the lines charts. I started with Sales and then duplicated the sheet and replaced Sales with Profit Ratio and Order Quantity, leaving me with three separate worksheets.
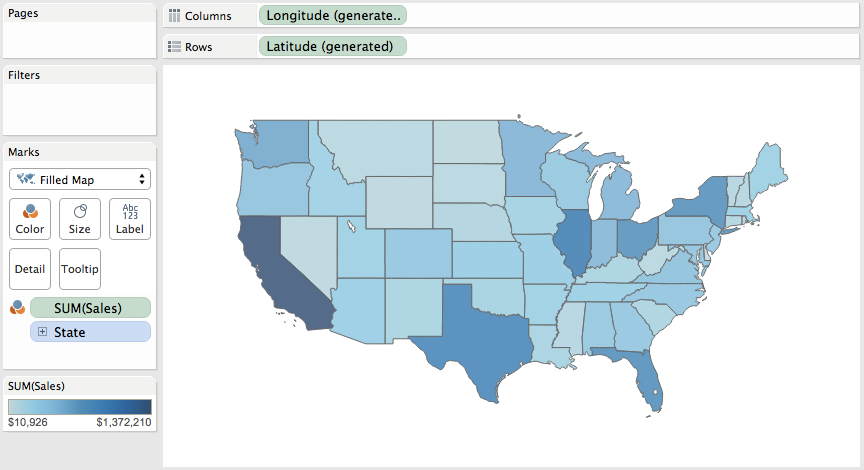
Step 2 - Create a map for each metric. Again, I end up with one worksheet for each metric.
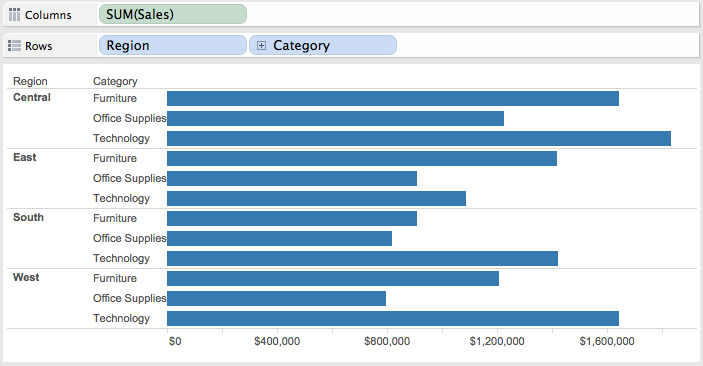
Step 3 - Create a bar chart for each metric, giving us three more worksheets for a total of nine.
Step 4 - Create a parameter with a list of the metrics.
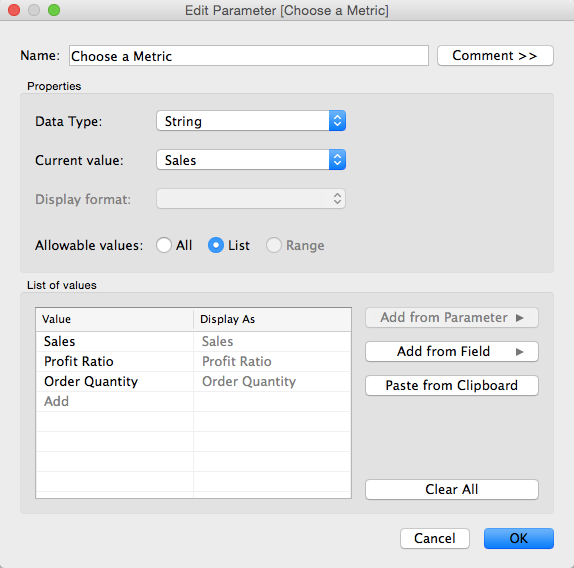
Step 5 - Create a calculated field to get the value selected in the parameter created in Step 4.
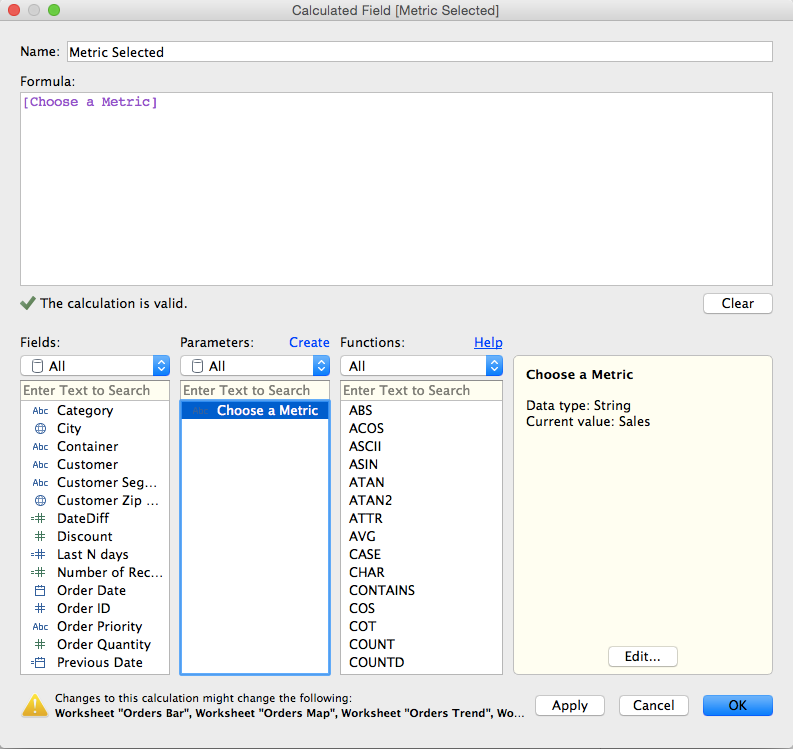
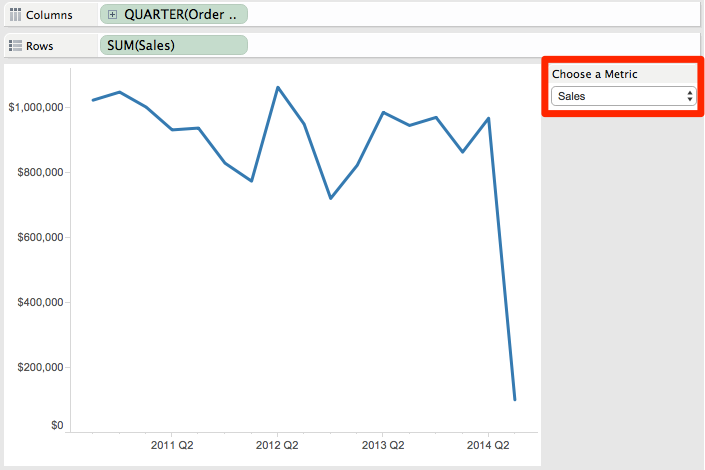
Step 6 - Show the parameter control on one of the Sales worksheets and choose Sales from the list.
Step 7 - For each of the worksheets that is using the Sales measure, drag the calculated field created in step 5 onto the Filters shelf and explicitly choose Sales from the list. There should only be one item in the list of available selections. Do NOT choose the "Use All" option or this hack won't work.
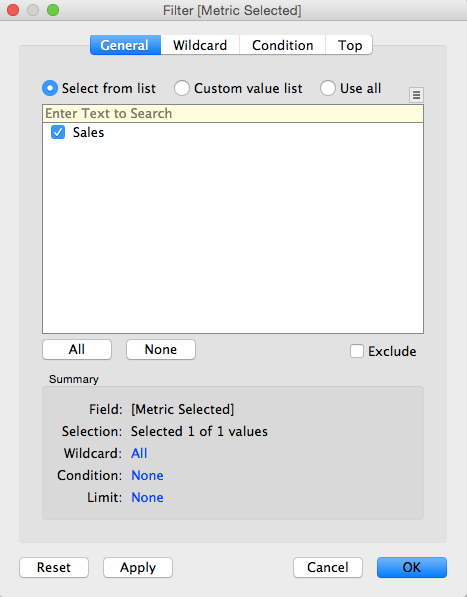
Note what happens when you change the selection in the parameter (e.g., choose Profit Ratio); the worksheet will go blank. This is exactly what we want because we want the Sales worksheets to go blank when a different metric is chosen. Go ahead, give it a try.
Step 8 - Change the metric chosen in the parameter to Profit Ratio and then add the calculated field created in step 5 onto the Filters shelf for each of the worksheets that contains Profit Ratio and explicitly choose Profit Ratio from the list.
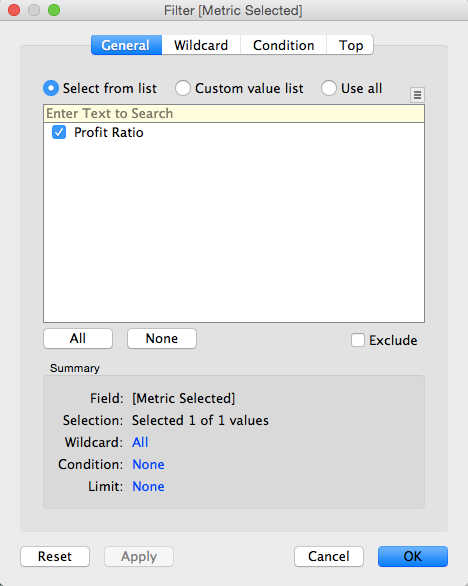
Again, notice how Profit Ratio is our only available selection in the filter list.
Step 9 - Repeat step 8, but this time choose Order Quantity and add the filter to each of the Order Quantity sheets.
Step 10 - Create a new dashboard.
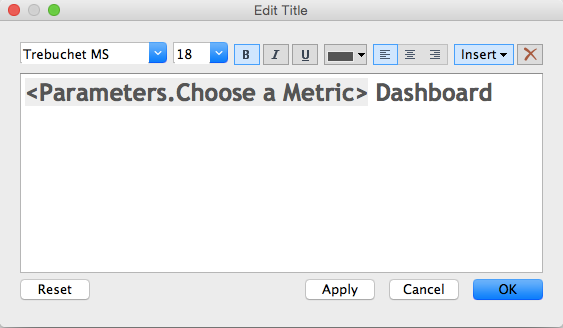
Step 11 (optional) - Add the title to the dashboard and in the title, include the parameter. This way the title will make the dashboard more intuitive.
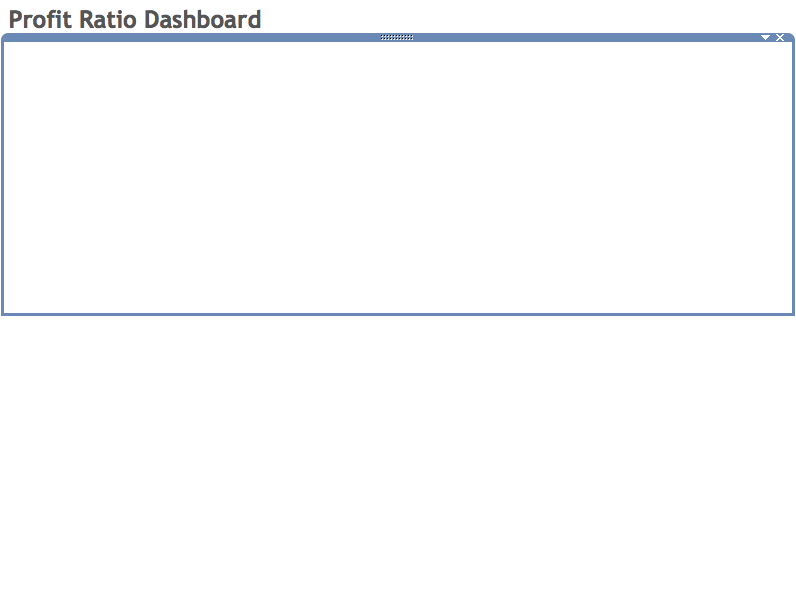
Step 12 - Add two horizontal containers to the dashboard, one above the other.
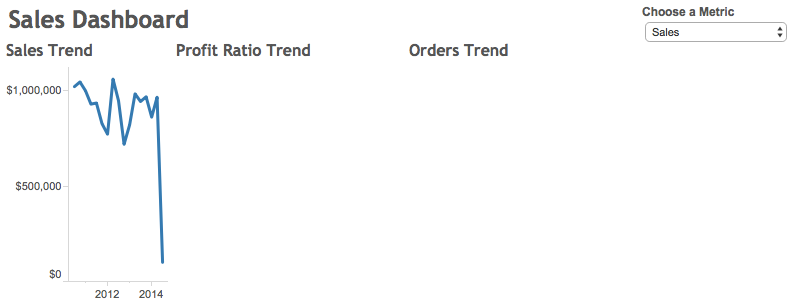
...then hide the titles for each worksheet.
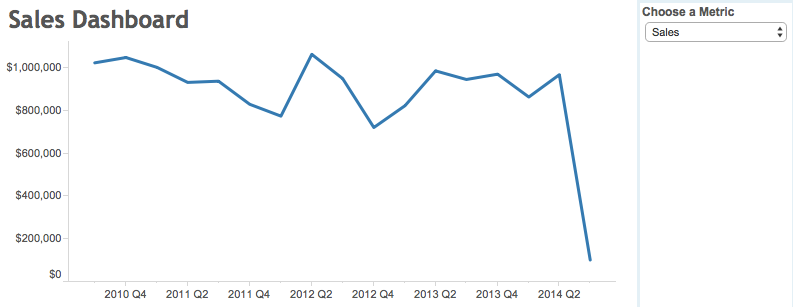
Step 14 - Add all of the maps and bar charts to the bottom container...
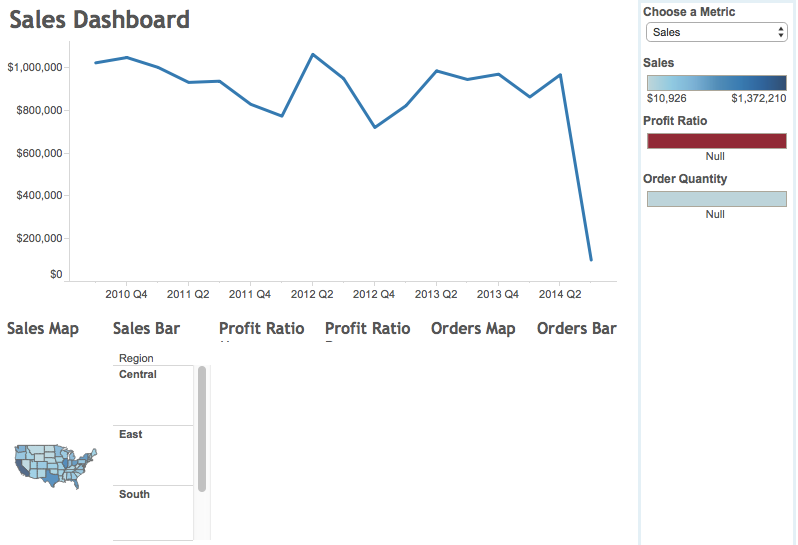
...then hide the titles for each worksheet.
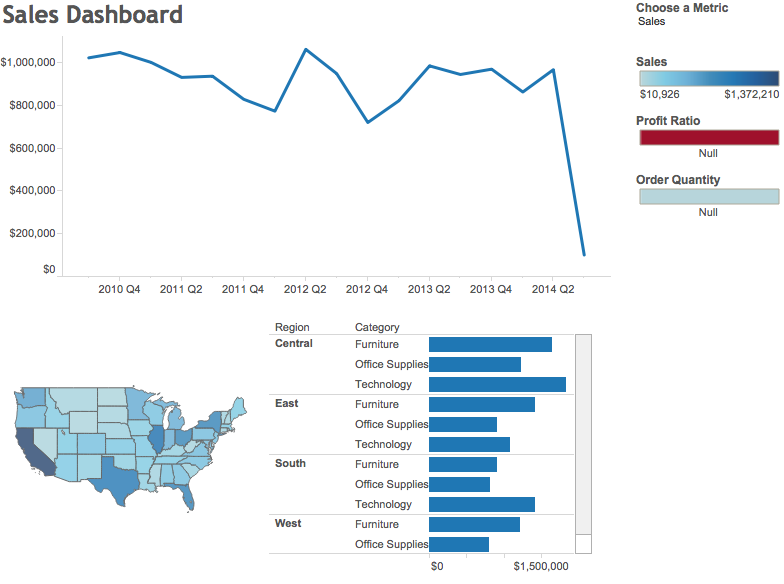
Step 15 - A bit of cleanup, like sizing the charts to fit the view, removing the color legends, making it all looks pretty and floating the parameter and you're all done!
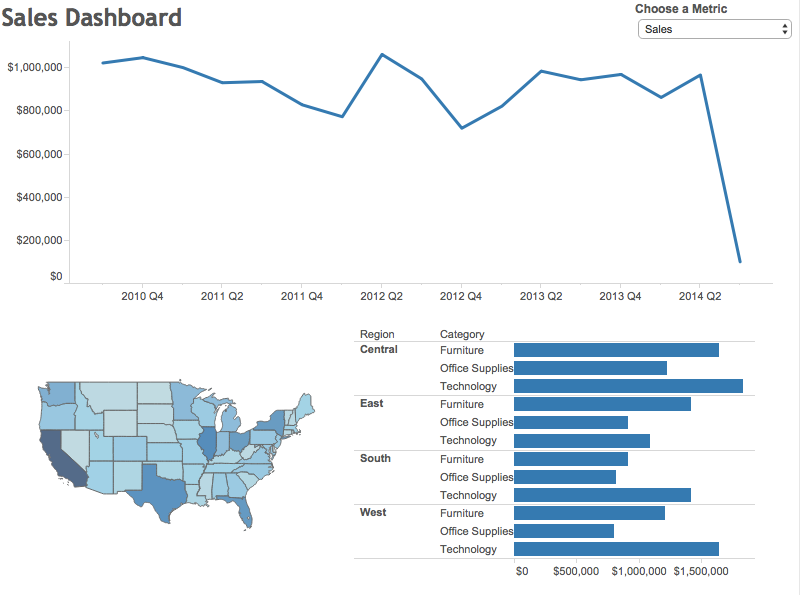
Go back to the viz at the top to play with the interactive version. Here's a video recording of how I built this dashboard.
Subscribe to:
Posts
(
Atom
)






