May 20, 2021
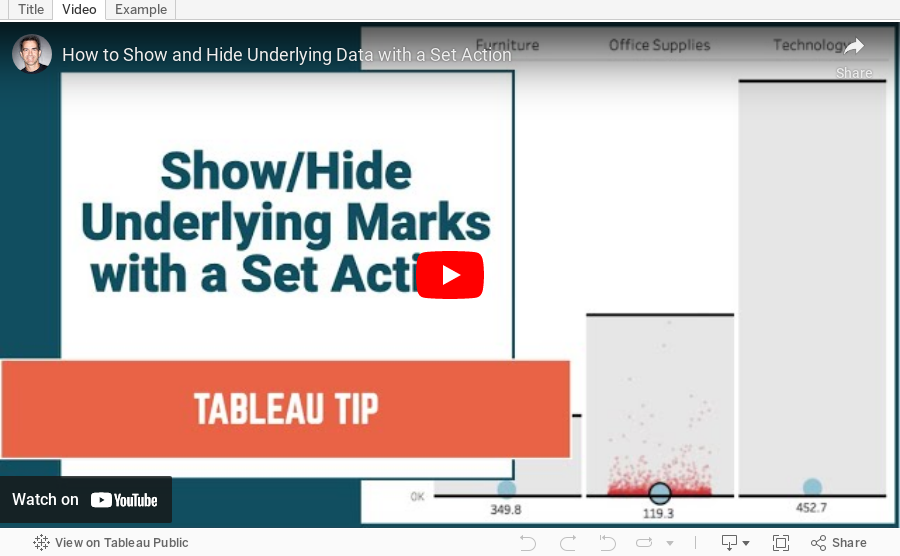
How to Show and Hide Underlying Data with a Set Action
calculated field
,
chart
,
comparison
,
context
,
distribution
,
dot plot
,
graph
,
hide
,
how to
,
jitter
,
random
,
reference band
,
set
,
set action
,
show
,
tableau
,
tip
,
tutorial
,
underlying data
No comments

I first saw this technique demonstrated by Lindsey Poulter; I've extended it to include jittering.
Subscribe to:
Post Comments
(
Atom
)


No comments
Post a Comment