May 3, 2021
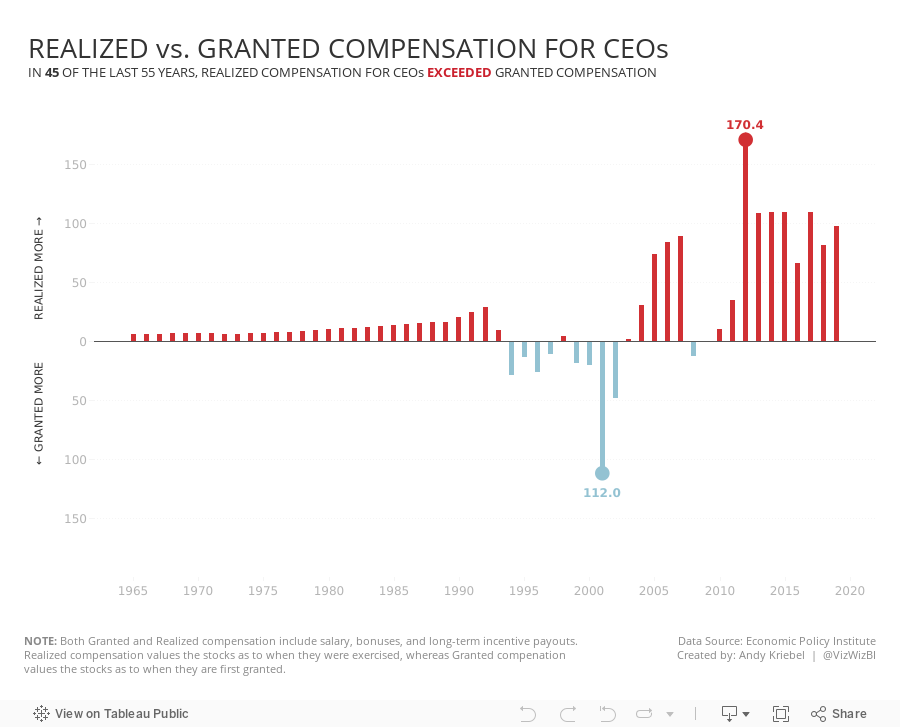
#MakeoverMonday 2021 Week 18 - Realized vs. Granted Compensation for CEOs
analysis
,
bar chart
,
circle timeline
,
comet
,
connected scatterplot
,
dashboard
,
gantt
,
heatmap
,
line chart
,
Makeover Monday
,
reference line
,
slope graph
,
stepped lines
,
tableau
,
variance
,
WatchMeViz
No comments

Charts created:
- Line Chart
- Stepped Lines
- Variance to baseline
- Win/Loss chart
- Comet Chart
- Gantt Chart
- Bar chart w/ reference line
- Connected scatter plot
- Slope Graph
- Circle Timeline
- Heatmap
- Data Set - https://data.world/makeovermonday/2021w18
- Chart chooser - https://datavizproject.com/
Subscribe to:
Post Comments
(
Atom
)


No comments
Post a Comment