March 22, 2023
How to Master Containers in Tableau

If you use Tableau, you might be wondering how to organize your dashboards effectively. That's where containers come in handy. In this series of videos, I'll cover everything you need to know about using containers in Tableau.
→ I'll explain what containers are and why they're important.
→ I'll show you how to create and customize containers in Tableau, including how to adjust their size and position on the dashboard.
→ I'll demonstrate how to add worksheets to containers and how to control the layout of those worksheets within the container.
→ I'll also cover how to resize containers and how to align them with other objects on your dashboard.
Throughout these tutorials, I'll provide helpful tips and best practices for using containers effectively. I'll also answer common questions you might have about using containers in Tableau, such as how to use containers with filters.
By the end of these tutorials, you'll have a solid understanding of how to use containers in Tableau to organize and present your data effectively. Whether you're a beginner or an experienced Tableau user, this tutorial is sure to help you take your dashboards to the next level.
So, if you're ready to learn how to use containers in Tableau, watch these tutorial now!
March 16, 2023
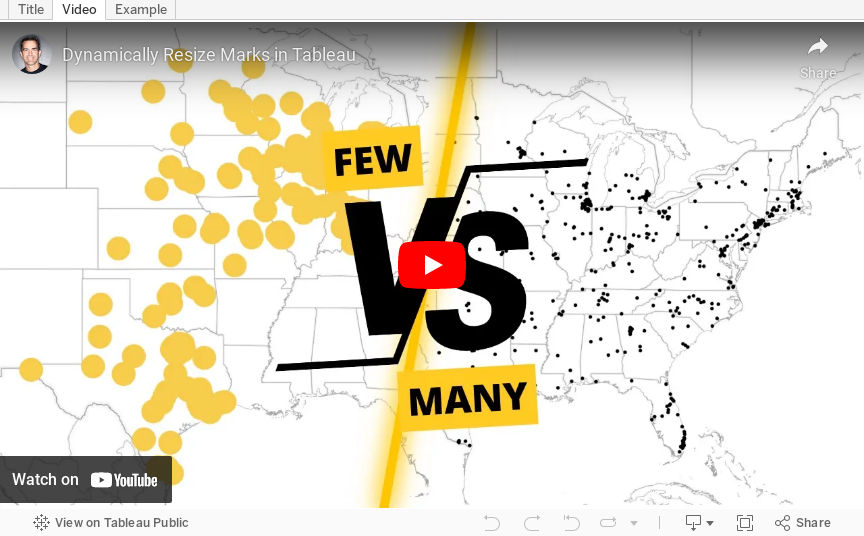
How to Dynamically Resize Marks in Tableau

In this video, I show you how to resize marks (in this case circles) dependent on how many marks are in the view. For example, if all possible marks are in the view (100%), the circles should be small. If only 10% of possible marks are in the view, the circles should be large.
I show how to do this on a map, but it can be extended to scatter plots, box plots, dot plots, jittered bar chart, and more.
March 1, 2023
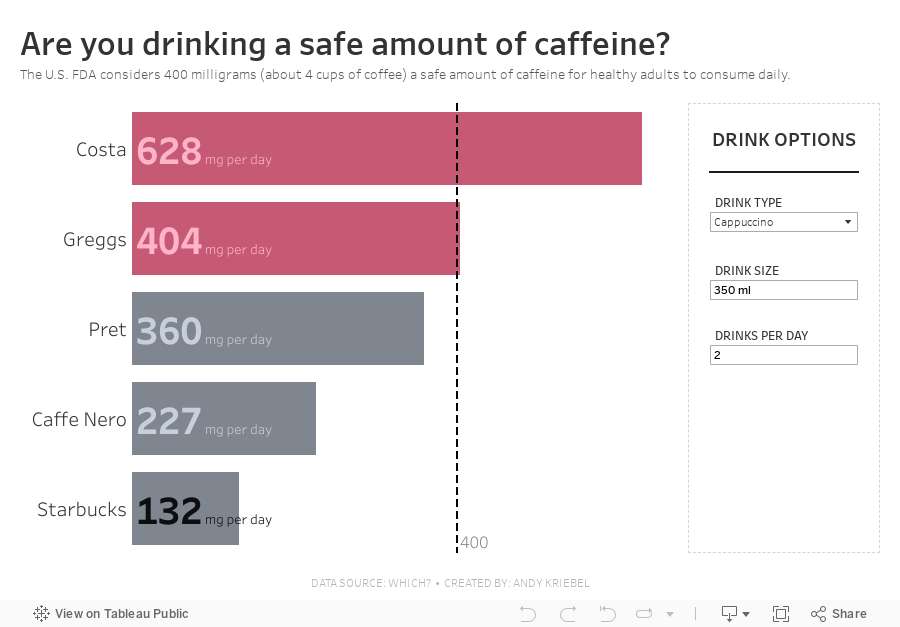
#MakeoverMonday 2023 Week 9 - Are you drinking a safe amount of caffeine?