March 16, 2023
How to Dynamically Resize Marks in Tableau

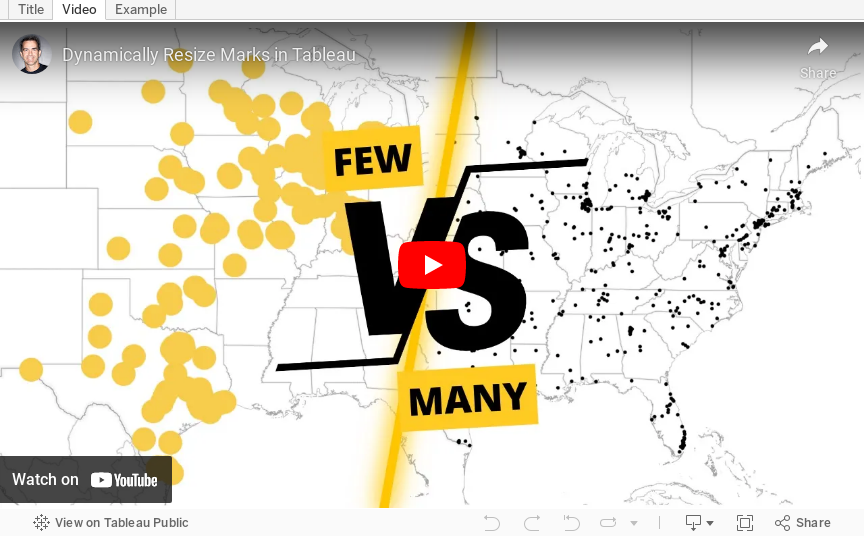
In this video, I show you how to resize marks (in this case circles) dependent on how many marks are in the view. For example, if all possible marks are in the view (100%), the circles should be small. If only 10% of possible marks are in the view, the circles should be large.
I show how to do this on a map, but it can be extended to scatter plots, box plots, dot plots, jittered bar chart, and more.
December 22, 2022
How to Calculate Customer Churn Rate in Tableau

In this tip, I’m show you how to calculate the 3-month and 6-month churn rate in Tableau. To calculate churn rate, all you need to do is:
1. Create 4 calculations
2. Follow the 8 simple steps to build the view
Customer churn rate is the % of customers that you’re losing in a predetermined time period. Churn rate is bad because if you don’t know how many customers are leaving, then you won’t know the impact on your revenue and you would be able to make changes to reduce churn.

August 16, 2018
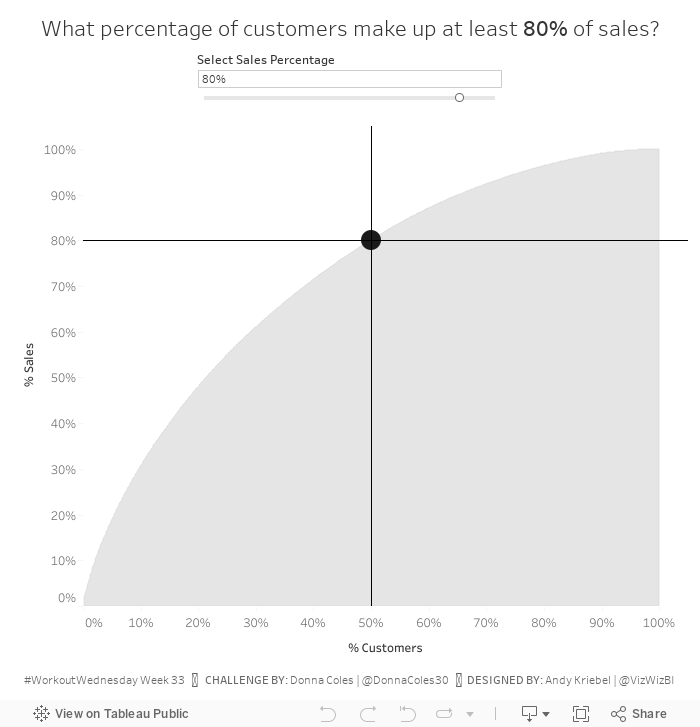
Workout Wednesday: How many customers make up XX% of sales?
Find all of the details of the challenge here. The only requirement I chose to ignore was the dashboard size. I created it 700x700 instead of 800x800 because it fit on my screen nicely.
Some hints for this challenge:
- You'll need to know your table calcs.
- This video will be helpful in creating the Pareto chart.
- You'll need extra calculations for the tooltip and the lines and the dot.

June 21, 2017
Workout Wednesday: The Value of Top 3 & Top 5 Contributors
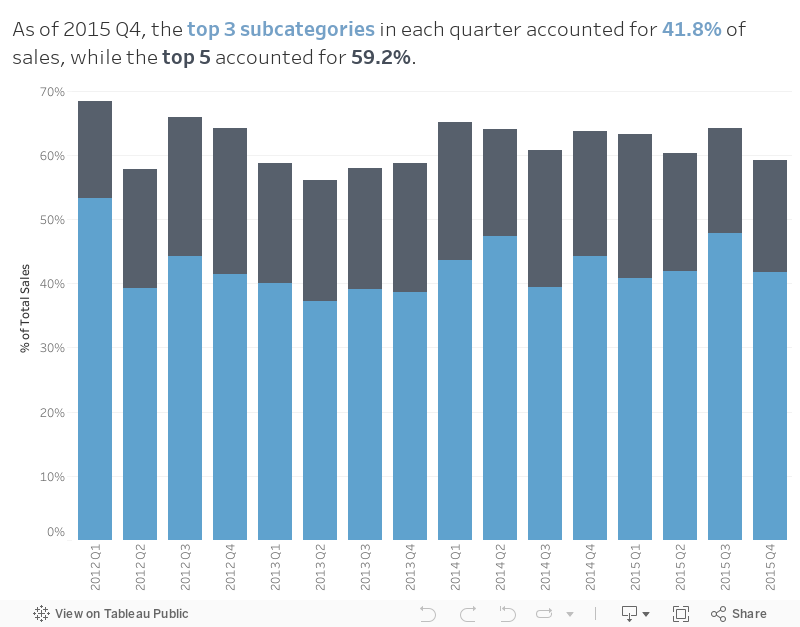
First, we wanted to understand what percentage of sales come from the top 3 and top 5 subcategories in each quarter, then we want to understand the cumulative contribution through time.
So that's your challenge. Build the viz below using this data source with these conditions:
- Match the title
- Match the tooltip
- Match the colors
- Show the contribution of the top 3 and the top 5 subcategories in each quarter
- Bar height represents the cumulative contributions from the first quarter
- Use only one worksheet
- Viz size is 800x600
I'm pretty sure that's everything. If I missed something, leave a comment or tweet me and I'll update the requirements. Remember to post you version to twitter and tag @EmmaWhyte and @VizWizBI. Good luck!
December 24, 2011
Heat Map: Manchester Derby Results Since 1907
The Soccer by the Numbers blog continues to provide me great inspiration. After Manchester City destroyed Manchester United 6-1 on October 23rd (at ManU), they blogged about the results and provided a bit of statistical analysis. City has long been the “noisy neighbors” to United, but they now are doing their best to buy a title, rather than grow their own talent. Soccer by the Numbers posed this fundamental question:
We now know that the outcome of the match was truly unusual. But how unusual?
They created the table below, which is a frequency distribution of scored lines since 1907 of matches at Manchester United. To use the chart you simply identify the score line by going across City’s scores then down ManU’s scores. So the 6-1 scoreline has occurred 2.99% of the time since 1907. Clearly this was an unusual result.

But I think this table could be improved. I made these changes:
- Changed the numbers to percentages and rounded to one decimal. Two decimals is unnecessary precision.
- Removed most of the gridlines so that the lines separate the data from the categories
- Formatted the results as a heat map. I chose a red-white two-color scheme since Red is ManU’s color. This makes the largest percentage of result very obvious. For example, you can now easily see, without having to scan across all of the data points, that 1-1 is the most common score line…boring result!
- Formatted the totals as a second heat map. I chose a brown-white scheme for these. The totals show you the % of the total goals scored for each time. ManU has scored one or two goals 64.2% of the time while City has scored one or two goals 58.2% of the time.

Which format do you like best? Does one make the story easier to interpret than the other?






