June 21, 2017
Workout Wednesday: The Value of Top 3 & Top 5 Contributors
bar chart
,
cumulative
,
level of detail
,
LOD
,
percentage
,
running total
,
table calc
,
Workout Wednesday
2 comments
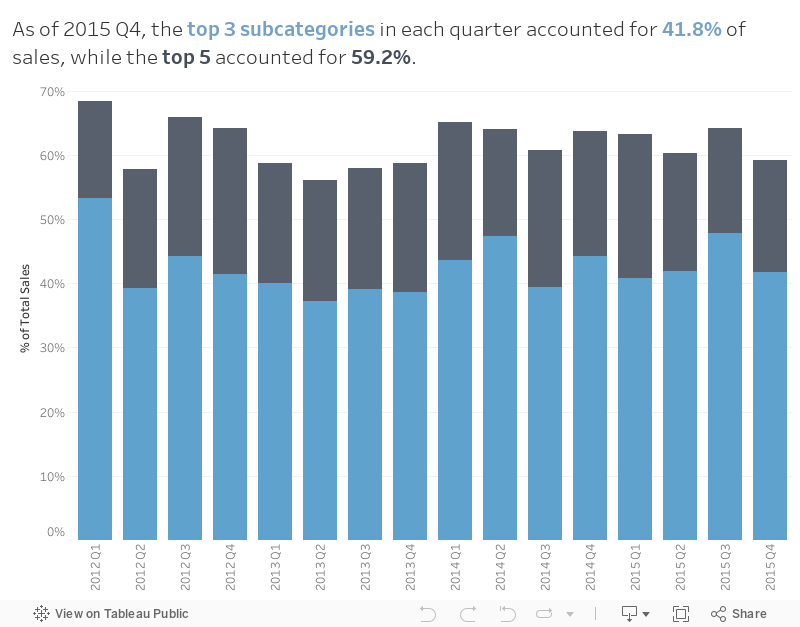
First, we wanted to understand what percentage of sales come from the top 3 and top 5 subcategories in each quarter, then we want to understand the cumulative contribution through time.
So that's your challenge. Build the viz below using this data source with these conditions:
- Match the title
- Match the tooltip
- Match the colors
- Show the contribution of the top 3 and the top 5 subcategories in each quarter
- Bar height represents the cumulative contributions from the first quarter
- Use only one worksheet
- Viz size is 800x600
I'm pretty sure that's everything. If I missed something, leave a comment or tweet me and I'll update the requirements. Remember to post you version to twitter and tag @EmmaWhyte and @VizWizBI. Good luck!
Subscribe to:
Post Comments
(
Atom
)


You say top 3 and 5 subcategories in the Title, but Products in the Tooltip. re we summing Sales for Subcategories or Products?
ReplyDeleteIt's subcategories. Sorry about that.
Delete