August 25, 2020
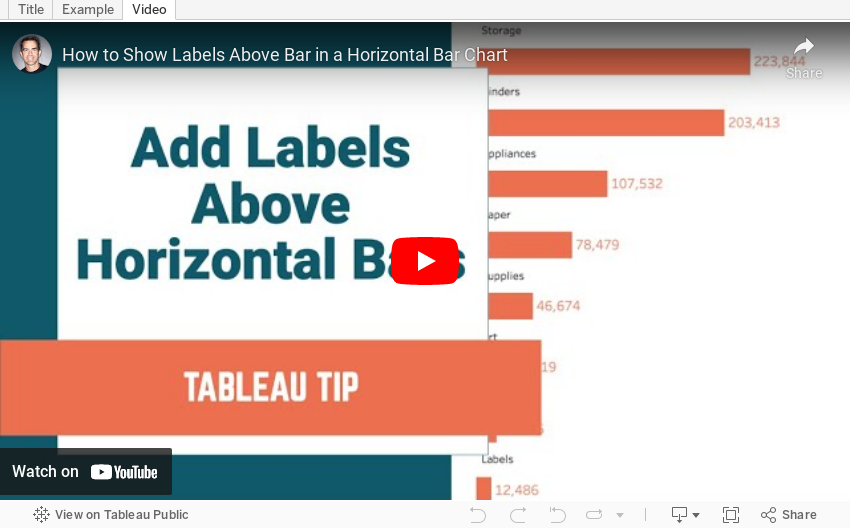
#TableauTipTuesday: How to Add Dimension Labels Above Bars in a Horizontal Bar Chart
bar chart
,
field label
,
label
,
labels
,
Tableau Tip Tuesday
,
tip
,
tips
No comments

Enjoy!
August 20, 2020
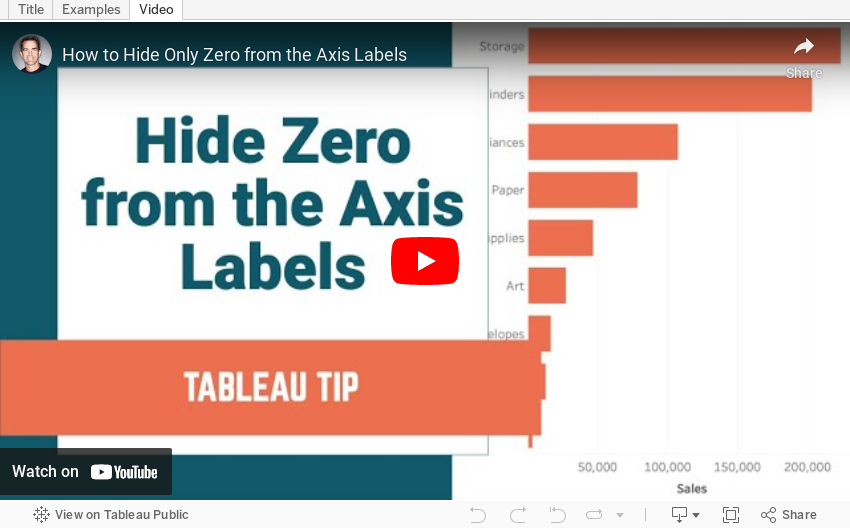
How to Hide Only Zero from the Axis Labels

Sometimes you don't want to show the zero label on an axis, but you still want to show all of the other axis labels. In this video, I show you how to do it.
Special thanks to Jeff Shaffer for showing me this trick during one of our TC Speed Tipping sessions.
August 13, 2020
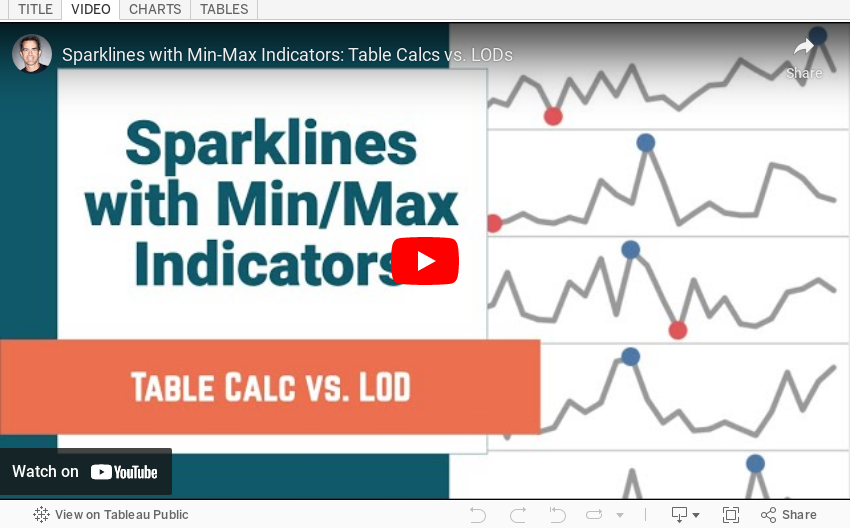
Sparklines with Min-Max Indicators: Table Calcs vs. LODs
calculation
,
indicators
,
level of detail
,
performance
,
sparkline
,
SQL
,
table calculation
,
tableau
,
tip
No comments

In this tip, I show you how to add circles on a sparkline at the minimum and maximum values for each line. I detail how to create them with both Table Calculations and Level of Detail Expressions and the benefits of each.
August 11, 2020
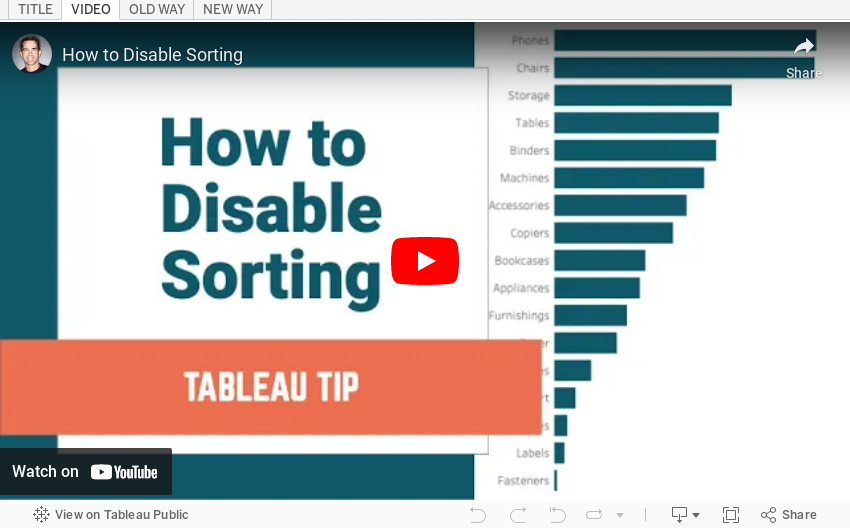
#TableauTipTuesday - How to Disable Sorting

There are times when you want to prevent your users from sorting a chart. This video has the solution for you.
Enjoy!
Subscribe to:
Posts
(
Atom
)


