March 5, 2018
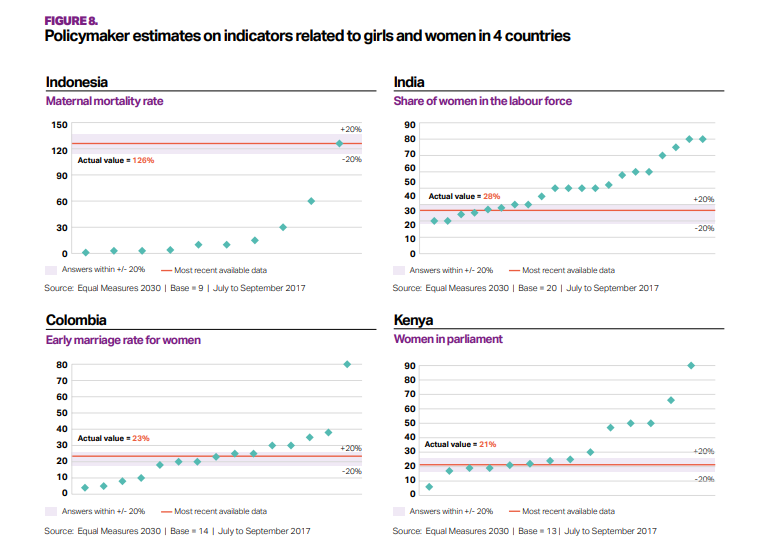
Makeover Monday: How good are policymakers at estimating indicators related to girls and women?
I ended up skimming through parts of the main report to get a better idea as to what the survey is about and any interesting findings they might describe.
In the end, there were major themes:
- Policymakers are really out of touch with the issues facing girls and women in the five countries in the study.
- Policymakers "think" they know what's going on.
What works well?
- The bands for +/- 20% from the actuals helps give context to the estimates from policymakers.
- The country titles and subtitles for the topic make is easy to know what each chart is about.
What could be improved?
- What do the green diamonds mean? Apparently they are policymaker estimates, but there's no indication of that in the dashboard.
- Why are these topics picked for these countries?
- Why is Senegal excluded?
- A more impactful and descriptive title would help.
- It's unnecessary to include the source and legend with each chart.
My Goals
- Try to understand the data; easier said than done
- Understand the spread of each topic within each country
- Show ALL responses
- Allow the user to filter and drill in to the topic they are interested in.
- Stick to the overall style guidelines from Equal Measures 2030
- Include BANs for the number of policymakers that estimated within +/- 20% of the actual values
January 11, 2015
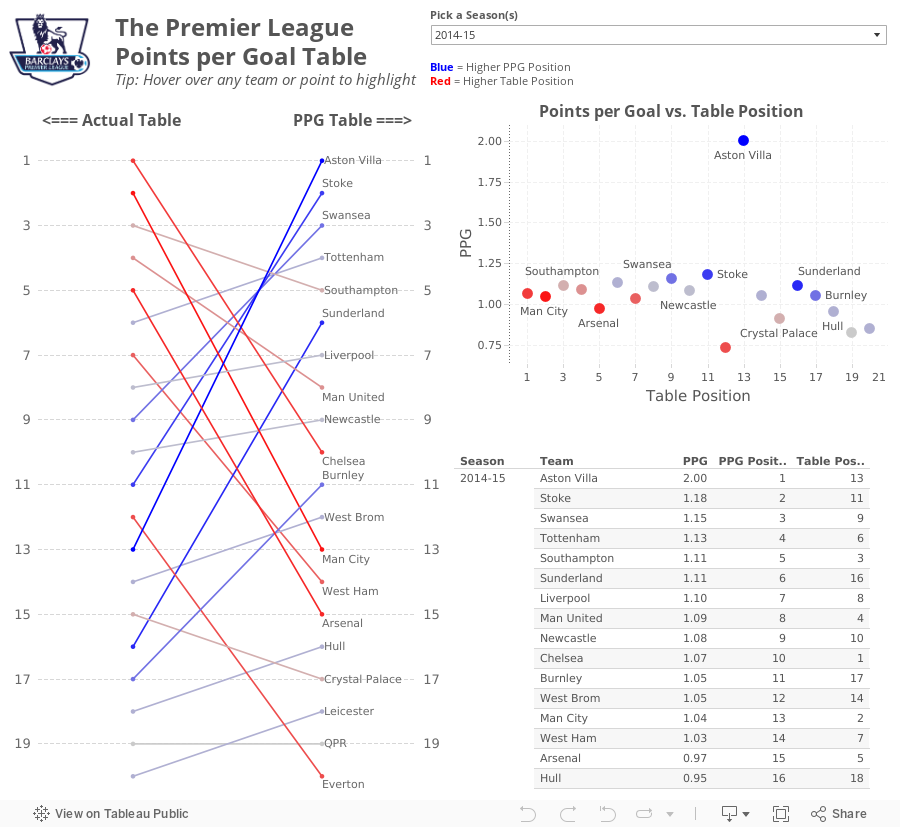
What If Premier League Standings Were Based on Points per Goal?
So far in the 2014-15 season, Aston Villa has the highest points per goal of any Premier League team in the last 10 seasons.This was quite intriguing to me, so this morning while I was enjoying a cup of coffee at Tully's I went to ESPNFC.com and downloaded the standings for the last 10 years. I added two columns to this dataset, which you can download here.
- Points per Goal (PPG)
- PPG Position (i.e., a rank of each team based on PPG)


From there, I wanted to understand the difference between Villa's actual place in the EPL table and their place in the fictitious points per goal table. For this view, I created a slopegraph, which I first wrote about creating in Tableau here.
If you're unfamiliar with slopegraphs, Andrew Wheeler summarizes them well in his paper "A Critique of Slopegraphs":
Slopegraphs show values for two numeric variables by line segments for each observation by connecting points on two parallel axes. They are frequently recommended for visualizing the changes in ranked data (Bertin, 2011; Tufte, 2001).I put all of the pieces together in this simple dashboard, which you can download here. Do you notice anything else interesting or unusual?
December 17, 2014
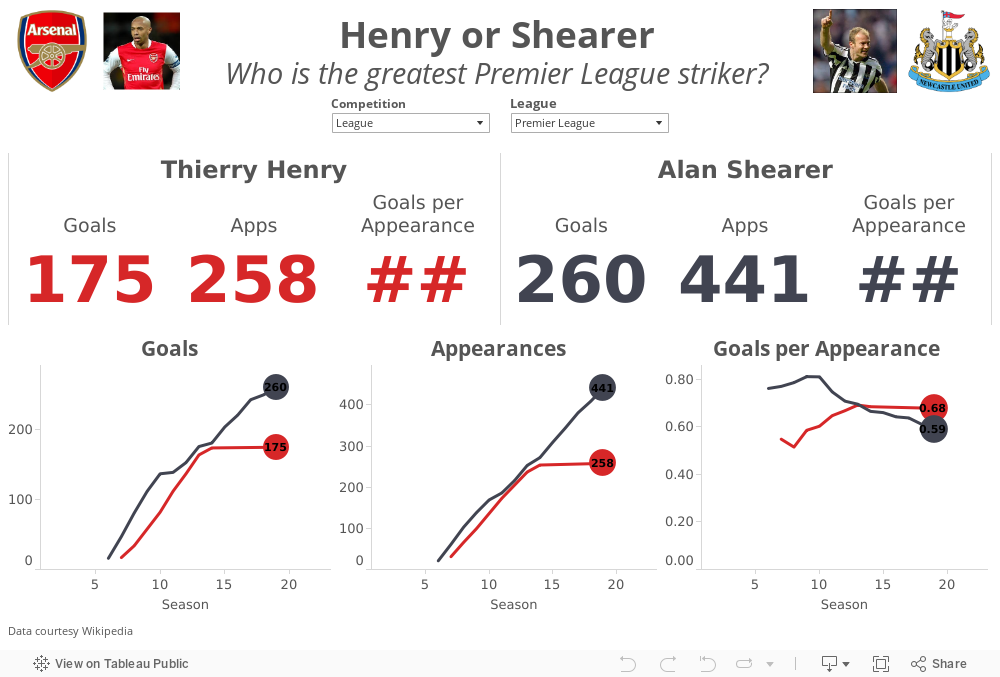
Henry or Shearer? Who is the greatest Premier League Striker?
In a tribute to The King, the Premier League created this great compilation video.
Henry's retirement led to the inevitable debate of who is the greatest Premier League striker ever? Most people agree that Thierry Henry and Alan Shearer are in a class by themselves. The great thing about sport is that it leads to lots of opinions and great debates. There are Henry camps and there are Shearer camps.
I gathered their career data from wikipedia (here and here) and combined them into a single spreadsheet here. I built this quick viz in Tableau to allow you to answer the question for yourself. Download the workbook here.
May 8, 2013
Was Theo Walcott’s performance for Arsenal driven by motivation for a new contract?
With two matches to go in the EPL season, Arsenal is in a battle for a Champions League spot with Chelsea and Tottenham and Theo Walcott is leading scorer. He started out the season in great form, then suddenly tapered off immediately after he signed a new deal with the club.
In Arsenal’s last two matches, Theo has scored two great goals very early on in the game, at the 2’ mark against the champions Manchester United and 20 seconds into the most recent game against relegated QPR. Theo is back in form.
I was interested to see how Theo has impacted Arsenal’s overall performance. Use the viz below to see how Arsenal performs when Theo does or does not play (Arsenal have a higher winning % when he doesn’t play, though in a small sample size) and when he does or does not score (their winning % increases by 20% when he plays and scores vs. when he plays and doesn’t score).
In other words, Arsenal need Theo to play and score.

January 16, 2012
Arsenal continues to stumble. Have they become too dependent on Van Persie? The stats don’t lie!
Another weekend has passed by and another totally lackluster effort from my beloved Gunners. I knew they were in deep, deep trouble when they scored so early in the game and of course it was Robin Van Persie with another classy finish. This makes three games I can think of where Arsenal scored really early and couldn’t hold on. Surely there were other occasions as well.
Miraculously someone other than RVP scored later in the game (Theo Walcott), but when the final whistle blew and there were few chances created, I began to ponder what could happen if RVP gets hurt (some might say when instead of if). Arsenal’s dependency on RVP has been staggering this season.
I created the viz below based on club and squad stats from ESPN Soccernet for EPL games.
Here’s how I designed it and what I’ve observed:
- Anything in red = Robin Van Persie
- The dotted lines represent the averages over the 11 seasons
- There’s no stat that measures effort, desire or heart. Thankfully, I guess, or the Gunners would be at the bottom of that table. They play so gutlessly at times!
- The primary team stats are shown on the upper left for the last 11 EPL campaigns. This provides a nice little recipe for what you need to do to ensure you tumble right down the table and out of the Champions League qualification spots.
Fewer Goals For + More Goals Against = Lower Goal Differential = Fewer Points per Game = More Losses = Tumble Down the Table = No Champions League!
In other words, if you can’t score and you can’t defend, you won’t win. Seems pretty simple to me. - Arsenal is 21 games into the 2011-12 season and only one player has more than five goals. All other years had at least four, with the exception of 2003-04, but Thierry Henry had an exceptional season, scoring 30 goals or 41.1% of the teams’ goals.
Click on a year and you’ll be taken to another page that list the stats for they players that scored five or more goals that season. - I charted scoring rate (goals per game) vs. % of total team goals. This give us a way to measure a player’s total scoring importance to the team. Guess who the outlier is at the way upper-right. Hover over any point for more details.
- The bottom three charts show the number of goals, % of team goals and scoring rate for the top scorer for each season. Again, hover over any bar for more details.
As I had thought, RVP is scoring a never before seen percentage of the team goals (45%). What more proof could Wenger need that he must bring in some reinforcements?
You might say that Arsenal depended heavily on TH14 during their glory years as well, but he had a much better supporting cast, as evidenced by the number of players with five or more goals. Plus Henry was nearly always fit, while RVP has proven to be very brittle over his tenure.
You can also look at GAA during those same years. Arsenal was truly a “team” back then, now…not so much!
What Arsenal needs to do to turn things around is pretty simple: score more goals and defend better. Personally, I don’t think the backline is as bad as it appears. I blame the outside midfielders for lack of effort and not tracking back to support the defense. If they’re going to be that lazy, they better at least score some goals.
What Arsenal needs is another consistent goal scoring threat. While I love Henry, I don’t think he’s the answer, especially since he’s only on loan. A long-term solution is needed. I fear without another formidable striker, the Gunners could easily finish outside the, gulp, top 8!
December 24, 2011
Heat Map: Manchester Derby Results Since 1907
The Soccer by the Numbers blog continues to provide me great inspiration. After Manchester City destroyed Manchester United 6-1 on October 23rd (at ManU), they blogged about the results and provided a bit of statistical analysis. City has long been the “noisy neighbors” to United, but they now are doing their best to buy a title, rather than grow their own talent. Soccer by the Numbers posed this fundamental question:
We now know that the outcome of the match was truly unusual. But how unusual?
They created the table below, which is a frequency distribution of scored lines since 1907 of matches at Manchester United. To use the chart you simply identify the score line by going across City’s scores then down ManU’s scores. So the 6-1 scoreline has occurred 2.99% of the time since 1907. Clearly this was an unusual result.

But I think this table could be improved. I made these changes:
- Changed the numbers to percentages and rounded to one decimal. Two decimals is unnecessary precision.
- Removed most of the gridlines so that the lines separate the data from the categories
- Formatted the results as a heat map. I chose a red-white two-color scheme since Red is ManU’s color. This makes the largest percentage of result very obvious. For example, you can now easily see, without having to scan across all of the data points, that 1-1 is the most common score line…boring result!
- Formatted the totals as a second heat map. I chose a brown-white scheme for these. The totals show you the % of the total goals scored for each time. ManU has scored one or two goals 64.2% of the time while City has scored one or two goals 58.2% of the time.

Which format do you like best? Does one make the story easier to interpret than the other?






