Showing posts with label count distinct. Show all posts
November 17, 2022
How to Create a 3 Level Scatterplot Drilldown
3 level drill down
,
analysis
,
color
,
count distinct
,
create set
,
dashboard action
,
data visualization
,
drill down
,
drilldown
,
how to
,
level of detail
,
LOD
,
scatterplot
,
set action
,
tableau
,
tip
No comments
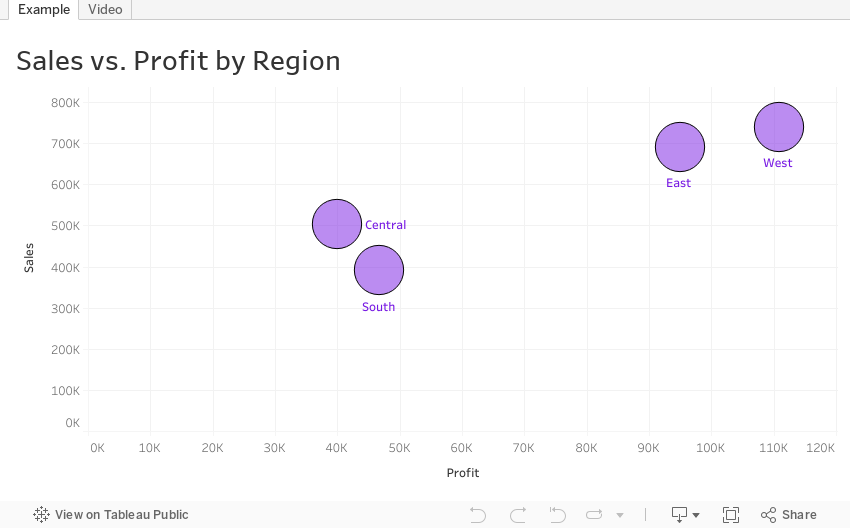
If you want to drilldown multiple levels in a scatterplot, this tip is for you. In this tip, I show you have to create a 3 level drilldown with a scatterplot.
Naturally after I showed how to create a 3 level bar chart drilldown, someone immediately asked how to do it with a scatterplot. Unlike the bar chart drilldown, the scatterplot will only show you marks for the current level.
For example:
- When I’m at the highest level, I see only regions.
- When I drill down one level, I only see States within the Region selected
- When I drill down one more level, I only see postal codes that are within the region and state I selected.
This example shows you how to drill down from Region to State to Postal Code. To use this for yourself:
- Download the workbook
- Copy all of the calculations into your workbook
- Swap out the dimensions
Note that you will need to recreate the sets and set actions. This will work with any combination of 3 dimensions.
January 29, 2019
Using an LOD to Count Marks in a View

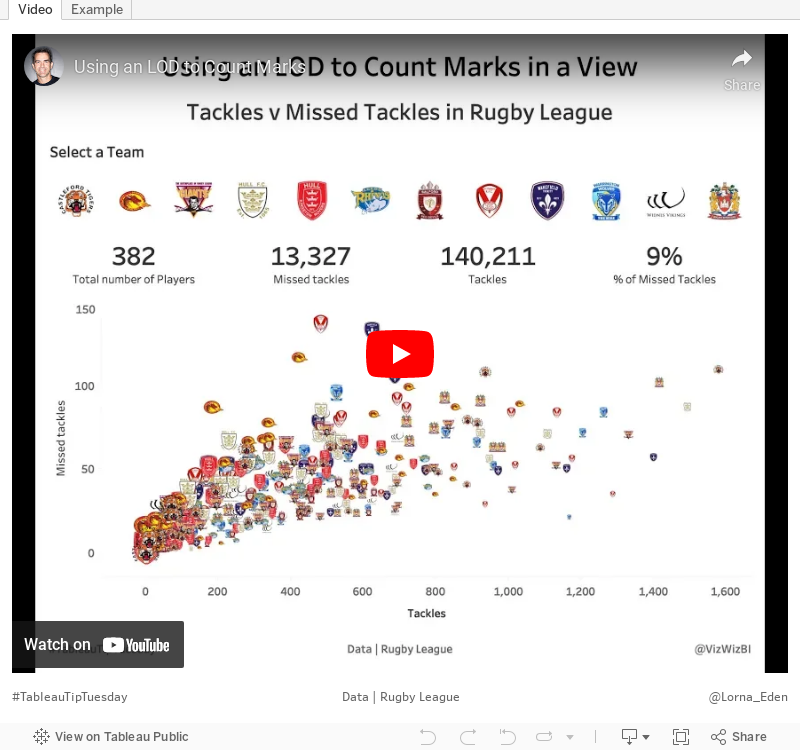
I also show how to combine multiple, disparate BANs into a single sheet.
August 16, 2018
Workout Wednesday: How many customers make up XX% of sales?
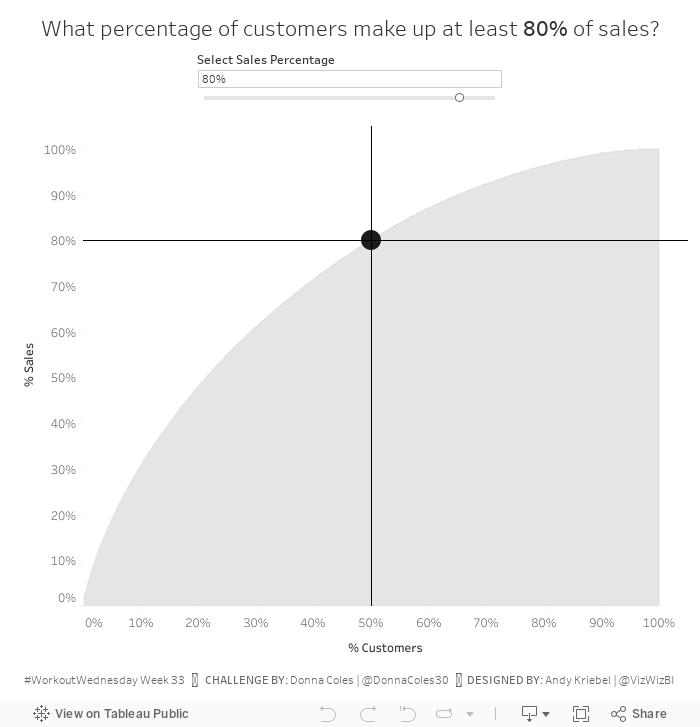
On yesterday's Makeover Monday Viz Review, guest host Ann Jackson gave me a bit of grief for not participating in too many Workout Wednesday's this year. I've taken on her challenge and this week I've complete week 33. This week was a community challenge from Donna Coles, who has completed every WW since it started in January 2017.
Find all of the details of the challenge here. The only requirement I chose to ignore was the dashboard size. I created it 700x700 instead of 800x800 because it fit on my screen nicely.
Some hints for this challenge:

Find all of the details of the challenge here. The only requirement I chose to ignore was the dashboard size. I created it 700x700 instead of 800x800 because it fit on my screen nicely.
Some hints for this challenge:
- You'll need to know your table calcs.
- This video will be helpful in creating the Pareto chart.
- You'll need extra calculations for the tooltip and the lines and the dot.
That's all I'm going to give you; the rest you need to figure out on your own. Good luck!
July 26, 2017
Workout Wednesday: Order Analysis with LODs
action filter
,
context
,
count distinct
,
level of detail
,
LOD
,
top
,
Workout Wednesday
7 comments
Pretty straight forward Workout Wednesday this week. Here are Emma's requirements:

- The first chart should could the number of customers by the number of orders they have made.
- The first chart should have its bars coloured blue for 10 orders and above.
- The title and tooltip should match as well. The title and tooltip changes as you select a Region.
- The bottom chart (Top 10 products) should be filtered by the Region also. The top 10 products should change depending on the Region you select.
- When you click on a bar in the top chart it should also filter the top 10 products.
- The title and tooltip on the second chart should also change when you select a Region.
For the first chart, I used a FIXED LOD to count the number of orders per customer. I then created a parameter for selecting the region. To ensure my FIXED LOD would use the filter I built off the parameter, I made sure to put it into context.
But I don't want to give away all the hints. Give it a go yourself. You can download the data here. Click on the image below for the interactive version.
July 27, 2012
Tableau Tip: Using the TOTAL function to summarize dimensions
UPDATE (7 Sept 2016): There is now a much easier way to do this with LOD expressions. I have created a video tutorial an example here.
One of the great benefits of working with brilliant people is that you get challenging questions. When those questions are about Tableau, I’m nearly always convinced that what the person is trying to do can be done.
Wednesday was another great example. Assume you have a table that measures sales by year by customer. You’re only interested in customers that have more than $35,000 in sales per year.

And you don’t care who the customers are, just how many. Restating the question: How many customers have bought over $35,000 of products in a year and what was the total value of those sales? This is a simple question, but it wasn’t as easy to do in Tableau as I thought.
My initial thought was to simply change the Customers field to a distinct count, but that didn’t work because my individual customers are no longer listed. Ok, so I need all of the customers, but I don’t want to see them. Basically I’m looking for one row for each year. Each row will list year, # of customers over $35K, and total sales for those customers.
Here’s how to do it. I’m going to assume that you are starting with a view like this.

Step 1 – Create a calculated field to count all of the customers in the view (note that I’m working with an Excel data source, so COUNTD is only available if I make it an extract).

Step 2 – Drop the Customer Count measure onto the data area. You will see the Customer Count field appear in the Measure Values shelf.
Step 3 – Right-click on the Customer Count measure in the Measure Values shelf and choose Edit Table Calculation.
Your view should now look like this. Notice how the Customer Count field shows the same total number of Customers in each row for each year.

Step 4 – Create a calculated field to total all of the sales in the view

Step 5 – Drop the Total Sales measure onto the data area. You will see the Total Sales field appear in the Measure Values shelf.
Step 6 – Right-click on the Total Sales measure in the Measure Values shelf and choose Edit Table Calculation.
Your view should now look like this. Notice how the Total Sales field now shows to total sales by year on each row.

Step 7 – Drop the Number of Records measure onto the data area. You will see the Number of Records field appear in the Measure Values shelf.
Step 8 – Right-click on the Number of Records measure in the Measure Values shelf and change the aggregation from Sum to Average.
Step 9 – Right-click on the Number of Records measure in the Measure Values shelf and choose Add Table Calculation.
Your view should now look like this. Notice the running total we’ve added and how it restarts every year. What we’re doing here is simply counting the number of rows in each pane.

Step 10 – Cleanup time!

I have a sneaking suspicion that I’m overlooking a very simple way to do this, so if I am, please let me know. Either way, this works.
Download the workbook here.
One of the great benefits of working with brilliant people is that you get challenging questions. When those questions are about Tableau, I’m nearly always convinced that what the person is trying to do can be done.
Wednesday was another great example. Assume you have a table that measures sales by year by customer. You’re only interested in customers that have more than $35,000 in sales per year.
And you don’t care who the customers are, just how many. Restating the question: How many customers have bought over $35,000 of products in a year and what was the total value of those sales? This is a simple question, but it wasn’t as easy to do in Tableau as I thought.
My initial thought was to simply change the Customers field to a distinct count, but that didn’t work because my individual customers are no longer listed. Ok, so I need all of the customers, but I don’t want to see them. Basically I’m looking for one row for each year. Each row will list year, # of customers over $35K, and total sales for those customers.
Here’s how to do it. I’m going to assume that you are starting with a view like this.
Step 1 – Create a calculated field to count all of the customers in the view (note that I’m working with an Excel data source, so COUNTD is only available if I make it an extract).
Step 2 – Drop the Customer Count measure onto the data area. You will see the Customer Count field appear in the Measure Values shelf.
Step 3 – Right-click on the Customer Count measure in the Measure Values shelf and choose Edit Table Calculation.
- From the Compute Using list, choose Advanced…
- Move the Year of Order Date and Customer fields to the right and click OK.
- On the Table Calculation window, change the Restarting every option to Year of Order Date and click OK.


Your view should now look like this. Notice how the Customer Count field shows the same total number of Customers in each row for each year.
Step 4 – Create a calculated field to total all of the sales in the view
Step 5 – Drop the Total Sales measure onto the data area. You will see the Total Sales field appear in the Measure Values shelf.
Step 6 – Right-click on the Total Sales measure in the Measure Values shelf and choose Edit Table Calculation.
- From the Compute Using list, choose Advanced…
- Move the Year of Order Date and Customer fields to the right and click OK.
- On the Table Calculation window, change the Restarting every option to Year of Order Date and click OK.


Your view should now look like this. Notice how the Total Sales field now shows to total sales by year on each row.
Step 7 – Drop the Number of Records measure onto the data area. You will see the Number of Records field appear in the Measure Values shelf.
Step 8 – Right-click on the Number of Records measure in the Measure Values shelf and change the aggregation from Sum to Average.
Step 9 – Right-click on the Number of Records measure in the Measure Values shelf and choose Add Table Calculation.
- Change the Calculation Type to Running Total.
- From the Running Along list, choose Advanced…
- Move the Year of Order Date and Customer fields to the right and click OK.
- On the Table Calculation window, change the Restarting every option to Year of Order Date and click OK.


Your view should now look like this. Notice the running total we’ve added and how it restarts every year. What we’re doing here is simply counting the number of rows in each pane.
Step 10 – Cleanup time!
- Right-click on the Number of Records pill and choose Filter. Change the filter to be At Most 1. This will now keep only the first row in each year.
Notice how our Customer Count and Total Sales fields didn’t change. This is because we still have the Customers dimension in the view. - Drag the Number of Records pill off of the Measure Values shelf. Be sure to keep it on the filter shelf though.
Note: Steps 7 to 10.1 could all be combined into one step if we put the Number of Records field in the filter immediately. I didn’t do that because I wanted to demonstrate how we’re leveraging the running totals calculation in this example. - Move the Customers dimension from the Row shelf to the Level of Detail shelf.
- Remove Sum of Sales from the view. It’s no longer relevant.
- Right click on the two headers for the measures and rename them (Edit Alias).

I have a sneaking suspicion that I’m overlooking a very simple way to do this, so if I am, please let me know. Either way, this works.
Download the workbook here.
August 3, 2010
Tableau Tip: Using the COUNTD function with Excel
At the July 2010 Atlanta Tableau User Group meeting I was demonstrating how to create a Pareto chart in Tableau using the Superstore Sales dataset. Since I am a curious fellow, I plotted a reference line at 80% so that I could determine how many customers represent 80% of the profit. But wait, when you're using Excel as your data source, you cannot use the count distinct (COUNTD) function.

According to Tableau's documentation, you cannot count the distinct number of items in a group, e.g., the distinct number of customers. Here is the actual text from their website:
I thought I hit a wall. But I was determined and came up with a workaround. If you'll note in the graph above, there are 8 customer records. This is the number of records for that specific mark when you use the COUNT function; it's counting up the number of records in the dataset with that specific customer's name.
What I really wanted to know was how many customers are there to the left of 80%, i.e., the number of distinct customers. How did I do it?
First, I created a calculated field called # of Customers.
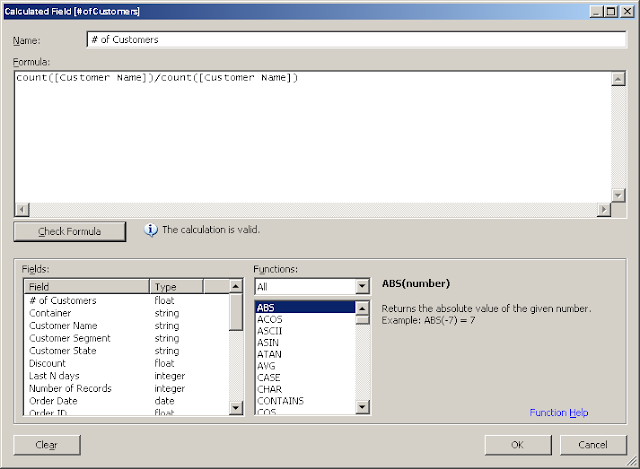
The formula is incredibly simplistic. Divide the count of customer records by the count of customer records. The result will always be one.
Next, add this calculated field to the Level of Detail shelf and create the Running Total of the Sum calculation as seen below.

Lastly, annotate the mark that's closest to 80%. Eureka! We have now identified that 145 distinct customers account for 80% of the profit.
I've only been able to get this calculation to count properly when working with a running total calculation and you have to create the calculated field for each of your dimensions, but at least it works in some situations.
In merely a minute or two you could easily identify that 345 products account for 50% of the sales.
According to Tableau's documentation, you cannot count the distinct number of items in a group, e.g., the distinct number of customers. Here is the actual text from their website:
- COUNTD(expression)
Returns the number of distinct items in a group. Null values are not counted. This function is not available if you are connected to MS Excel, MS Access, or a text file. You can extract your data into an extract file to gain this functionality.
I thought I hit a wall. But I was determined and came up with a workaround. If you'll note in the graph above, there are 8 customer records. This is the number of records for that specific mark when you use the COUNT function; it's counting up the number of records in the dataset with that specific customer's name.
What I really wanted to know was how many customers are there to the left of 80%, i.e., the number of distinct customers. How did I do it?
First, I created a calculated field called # of Customers.
The formula is incredibly simplistic. Divide the count of customer records by the count of customer records. The result will always be one.
Next, add this calculated field to the Level of Detail shelf and create the Running Total of the Sum calculation as seen below.
Lastly, annotate the mark that's closest to 80%. Eureka! We have now identified that 145 distinct customers account for 80% of the profit.
I've only been able to get this calculation to count properly when working with a running total calculation and you have to create the calculated field for each of your dimensions, but at least it works in some situations.
In merely a minute or two you could easily identify that 345 products account for 50% of the sales.
Subscribe to:
Posts
(
Atom
)






