August 3, 2010
Tableau Tip: Using the COUNTD function with Excel
At the July 2010 Atlanta Tableau User Group meeting I was demonstrating how to create a Pareto chart in Tableau using the Superstore Sales dataset. Since I am a curious fellow, I plotted a reference line at 80% so that I could determine how many customers represent 80% of the profit. But wait, when you're using Excel as your data source, you cannot use the count distinct (COUNTD) function.
According to Tableau's documentation, you cannot count the distinct number of items in a group, e.g., the distinct number of customers. Here is the actual text from their website:
- COUNTD(expression)
Returns the number of distinct items in a group. Null values are not counted. This function is not available if you are connected to MS Excel, MS Access, or a text file. You can extract your data into an extract file to gain this functionality.
I thought I hit a wall. But I was determined and came up with a workaround. If you'll note in the graph above, there are 8 customer records. This is the number of records for that specific mark when you use the COUNT function; it's counting up the number of records in the dataset with that specific customer's name.
What I really wanted to know was how many customers are there to the left of 80%, i.e., the number of distinct customers. How did I do it?
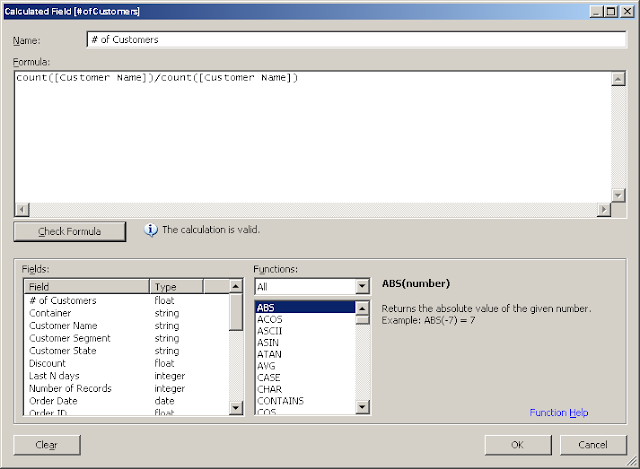
First, I created a calculated field called # of Customers.

The formula is incredibly simplistic. Divide the count of customer records by the count of customer records. The result will always be one.
Next, add this calculated field to the Level of Detail shelf and create the Running Total of the Sum calculation as seen below.

Lastly, annotate the mark that's closest to 80%. Eureka! We have now identified that 145 distinct customers account for 80% of the profit.
I've only been able to get this calculation to count properly when working with a running total calculation and you have to create the calculated field for each of your dimensions, but at least it works in some situations.
In merely a minute or two you could easily identify that 345 products account for 50% of the sales.
Subscribe to:
Post Comments
(
Atom
)


CountD is available with a simple extract in Tableau. Why not do that?
ReplyDeleteThanks for the comment. There are a couple of reasons that I didn't create an extract to do this.
ReplyDeleteFirst, I just wanted to see if there was a way to do a count distinct, knowing that an extract would make it really simple. So really, I saw it as a challenge.
Second, sometimes I don't use an extract if the source data in Excel changes often, which would make refreshing an extract inconvenient.
An extract works best in this situation, but it's good to know you can get a CountD to work in specific situations.