Showing posts with label action filter. Show all posts
January 11, 2022
How to Create a Calendar Widget for Filtering
action
,
action filter
,
analysis
,
calendar
,
calendar filter
,
chart
,
color
,
comparison
,
context
,
dashboard
,
dashboard action
,
filter
,
graph
,
how to
,
tableau
,
tip
,
widget
,
worksheet
No comments
Download the mock data set used in this tip on data.world.
July 28, 2020
#TableauTipTuesday - Using Set Actions to Change the Format of the Selected Value in a Dropdown Filter or Parameter
action
,
action filter
,
actions
,
dashboard action
,
format
,
formatting
,
parameter
,
parameter actions
,
parameters
,
set
,
set action
,
set actions
,
sets
,
Tableau Tip Tuesday
,
tip
,
tips
,
worksheet action
No comments


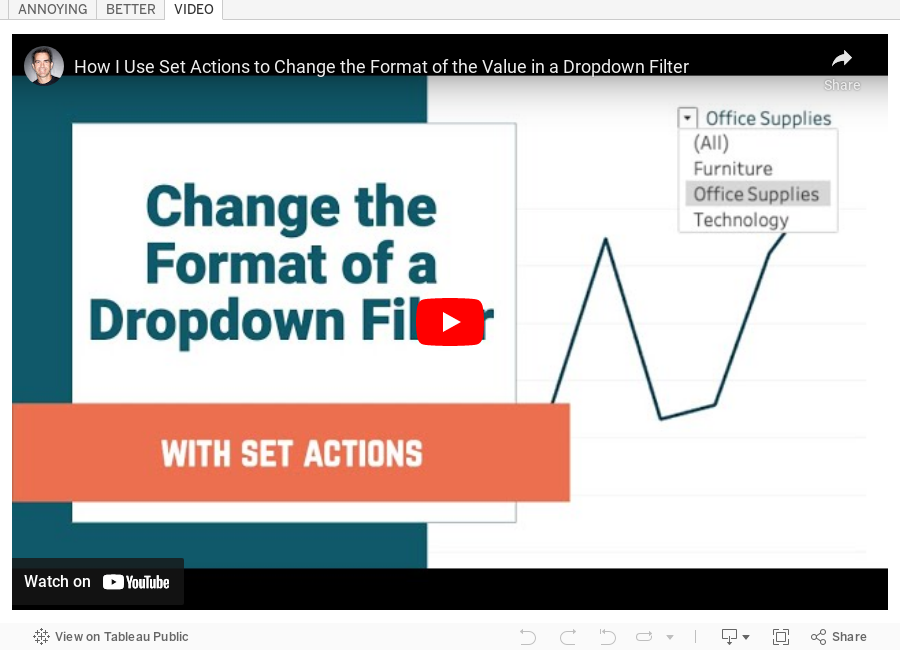
Notice how the font for "Office Supplies" next to the dropdown selector (9 pt) does not match the font size of the option displayed (12 pt). In this video, I show you how to work around that in a couple different methods.
- Using Category as a filter
- Using a Set Action so that the (All) option can also be displayed
The final product uses set actions. This method also applies to Parameters, but I have not included those in the video. The steps are mostly the same except you would use a Parameter Action instead of a Set Action.
Enjoy!
July 21, 2020
#TableauTipTuesday: Using Parameter Actions to Choose a Chart Type
action
,
action filter
,
actions
,
bar chart
,
chart
,
dashboard action
,
deselect
,
filter
,
line chart
,
map
,
parameter actions
,
select
,
Tableau Tip Tuesday
No comments

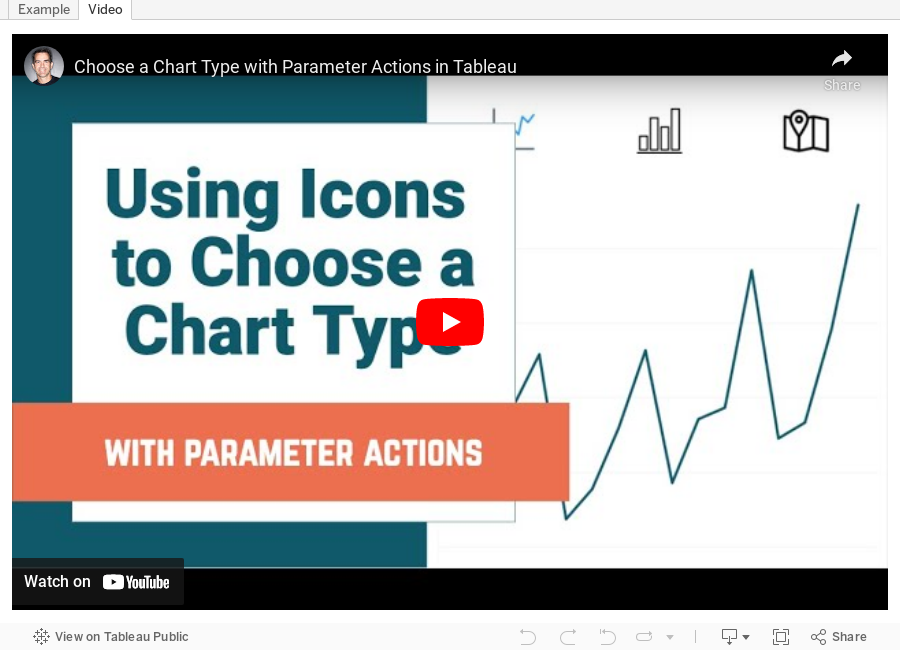
The icons I used are available via Flaticon here. Be sure to give credit to the creators of the icons unless you purchase them.
Enjoy!
June 2, 2020
#TableauTipTuesday: How to Compare to a Selected Value with a Set Action
action
,
action filter
,
actions
,
calculation
,
comparison
,
dashboard action
,
highlight
,
level of detail
,
LOD
,
LOD calc
,
set action
,
set actions
,
Tableau Tip Tuesday
,
variance
No comments

November 29, 2017
Workout Wednesday: Treemap Drilldown
This week's Workout Wednesday from Emma builds primarily on several previous challenges, primarily:

Go to Emma's blog for the requirements. For me, this was pretty straightforward as I'd done the other challenges. The only part that tripped me up was the sorting of the States. Once I got that figured out, it all fell into place.
Good luck! Here's my viz:
- Week 12: Highlight a Treemap
- Week 17: Product Spread Treemap (Part 1)
- Week 19: Product Spread Treemap (Part 2)
- Week 41: State to City Drilldown
If you haven't done those weeks yet, I would highly encourage you to tackle those first. They build upon each other and make this week's challenge much easier.
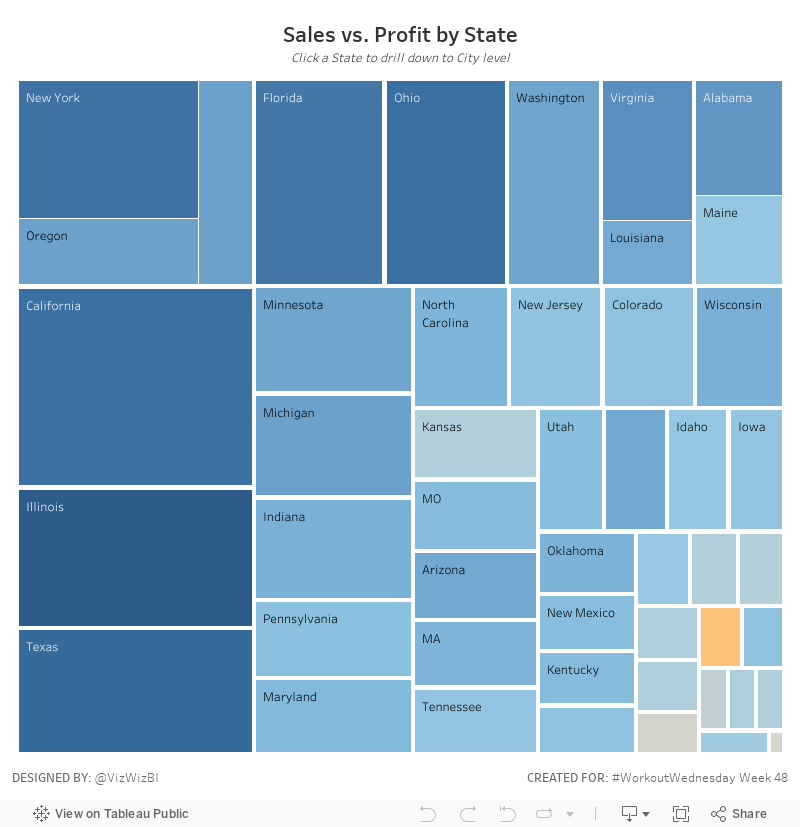
As for week 48, Emma asked us to build this treemap:
Go to Emma's blog for the requirements. For me, this was pretty straightforward as I'd done the other challenges. The only part that tripped me up was the sorting of the States. Once I got that figured out, it all fell into place.
Good luck! Here's my viz:
July 26, 2017
Workout Wednesday: Order Analysis with LODs
action filter
,
context
,
count distinct
,
level of detail
,
LOD
,
top
,
Workout Wednesday
7 comments
Pretty straight forward Workout Wednesday this week. Here are Emma's requirements:

- The first chart should could the number of customers by the number of orders they have made.
- The first chart should have its bars coloured blue for 10 orders and above.
- The title and tooltip should match as well. The title and tooltip changes as you select a Region.
- The bottom chart (Top 10 products) should be filtered by the Region also. The top 10 products should change depending on the Region you select.
- When you click on a bar in the top chart it should also filter the top 10 products.
- The title and tooltip on the second chart should also change when you select a Region.
For the first chart, I used a FIXED LOD to count the number of orders per customer. I then created a parameter for selecting the region. To ensure my FIXED LOD would use the filter I built off the parameter, I made sure to put it into context.
But I don't want to give away all the hints. Give it a go yourself. You can download the data here. Click on the image below for the interactive version.
Subscribe to:
Posts
(
Atom
)






