Showing posts with label select. Show all posts
January 24, 2023
How to Select a Date Range with a Set Action
calculation
,
color
,
custom dates
,
date range
,
dates
,
first
,
how to
,
last
,
level of detail
,
LOD
,
max date
,
min date
,
reference band
,
select
,
set action
,
summarize
,
tableau
,
tip
No comments

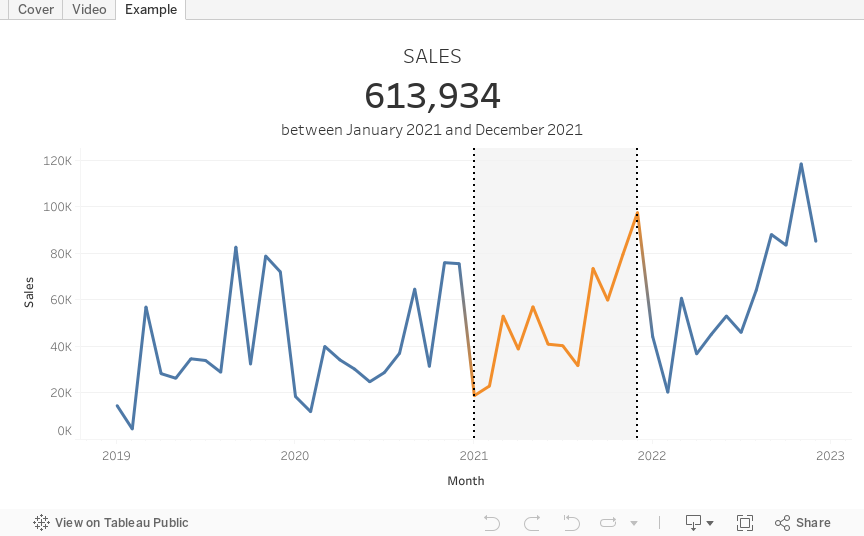
In this tip, I going to show you how to use set actions to select a date range in a line chart and summarize the values in the selected area.
In just a few steps, I’ll show you how to:
1. Create the custom date and set
2. Use the set to create a reference band
3. Color the line within the reference band
4. Calculate the totals sales within the date range
5. Configure the set action
October 11, 2022
#MakeoverMonday 2022 Week 41 - UNDP Human Development Index
action
,
country
,
development
,
hover
,
how to
,
human
,
index
,
interactivity
,
Makeover Monday
,
select
,
table in tooltip
,
tableau
,
tips
,
tooltip
,
UNDP
,
United Nations
,
viz in tooltip
,
WatchMeViz
No comments

From UNDP:
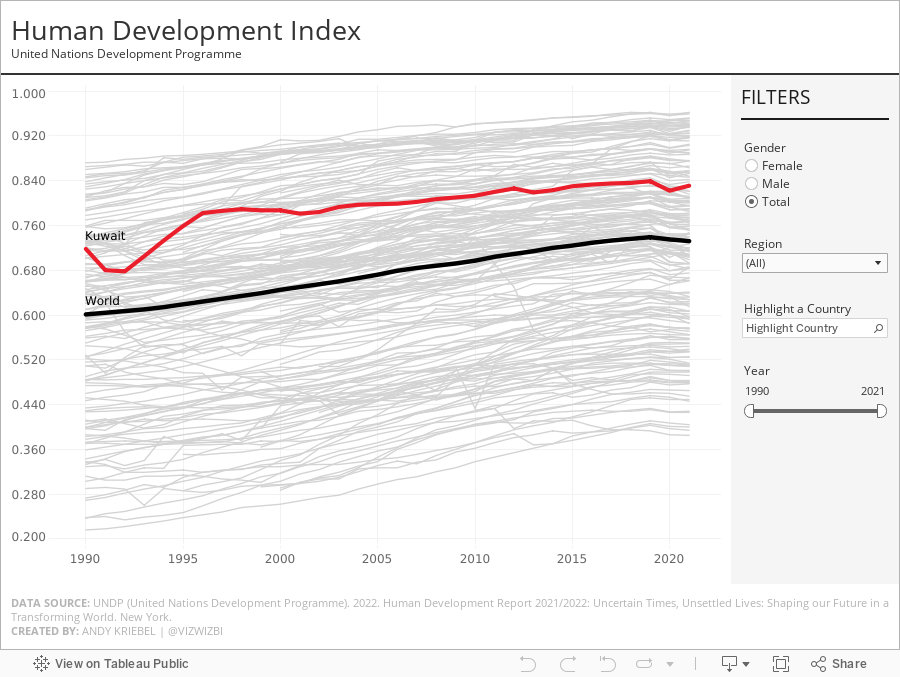
The Human Development Index (HDI) is a summary measure of average achievement in key dimensions of human development: a long and healthy life, being knowledgeable and have a decent standard of living. The HDI is the geometric mean of normalized indices for each of the three dimensions.
This week, I really liked the original visualization, so during #WatchMeViz, I spend the time recreating the visual. I got most of the way there in an hour and finished it off in the evening. The questions on the live stream are super helpful...thank you!
A couple things I learned:
- Hover action interactivity is very, very slow in Tableau. I ended up changing it to a select action.
- Labeling is overly complicated.
- Tables in a tooltip can look really good. And they are very responsive.
The final visualization is below the video. Thanks for watching!
July 21, 2020
#TableauTipTuesday: Using Parameter Actions to Choose a Chart Type
action
,
action filter
,
actions
,
bar chart
,
chart
,
dashboard action
,
deselect
,
filter
,
line chart
,
map
,
parameter actions
,
select
,
Tableau Tip Tuesday
No comments

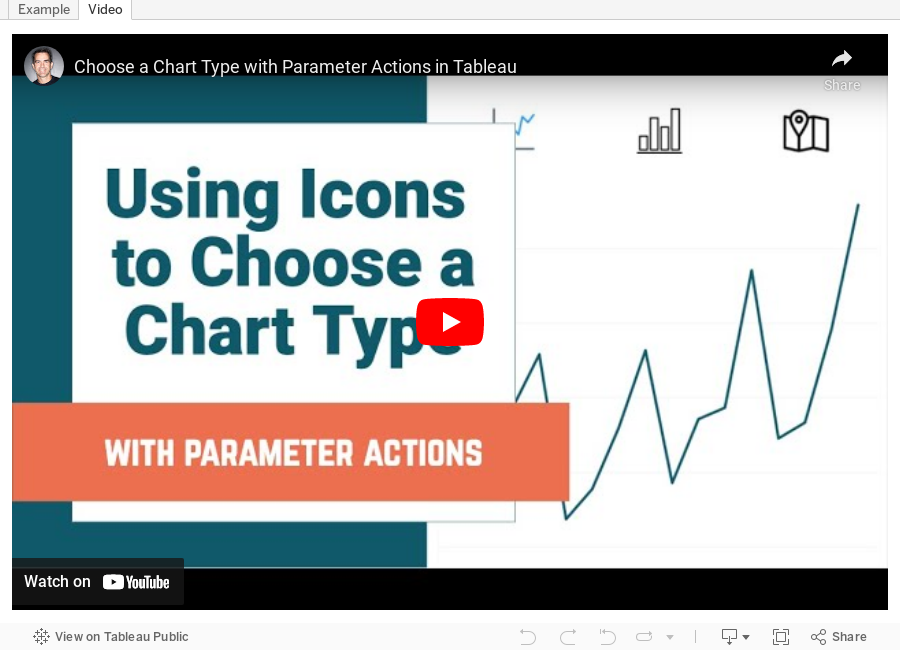
The icons I used are available via Flaticon here. Be sure to give credit to the creators of the icons unless you purchase them.
Enjoy!
Subscribe to:
Posts
(
Atom
)






