Showing posts with label hover. Show all posts
October 11, 2022
#MakeoverMonday 2022 Week 41 - UNDP Human Development Index
action
,
country
,
development
,
hover
,
how to
,
human
,
index
,
interactivity
,
Makeover Monday
,
select
,
table in tooltip
,
tableau
,
tips
,
tooltip
,
UNDP
,
United Nations
,
viz in tooltip
,
WatchMeViz
No comments

From UNDP:
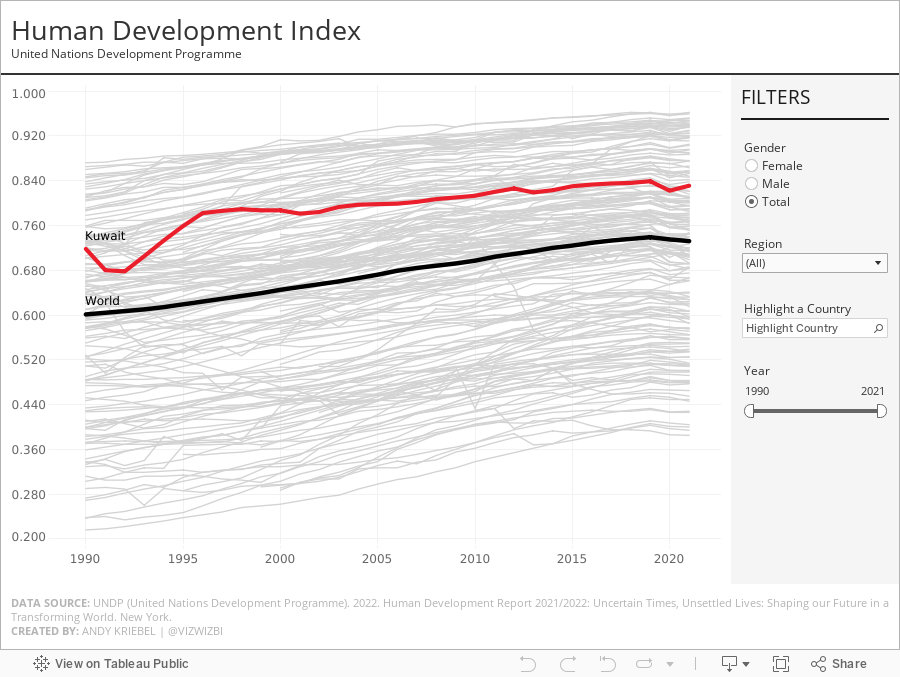
The Human Development Index (HDI) is a summary measure of average achievement in key dimensions of human development: a long and healthy life, being knowledgeable and have a decent standard of living. The HDI is the geometric mean of normalized indices for each of the three dimensions.
This week, I really liked the original visualization, so during #WatchMeViz, I spend the time recreating the visual. I got most of the way there in an hour and finished it off in the evening. The questions on the live stream are super helpful...thank you!
A couple things I learned:
- Hover action interactivity is very, very slow in Tableau. I ended up changing it to a select action.
- Labeling is overly complicated.
- Tables in a tooltip can look really good. And they are very responsive.
The final visualization is below the video. Thanks for watching!
August 22, 2017
Tableau Tip Tuesday: Using Actions to Highlight on Hover

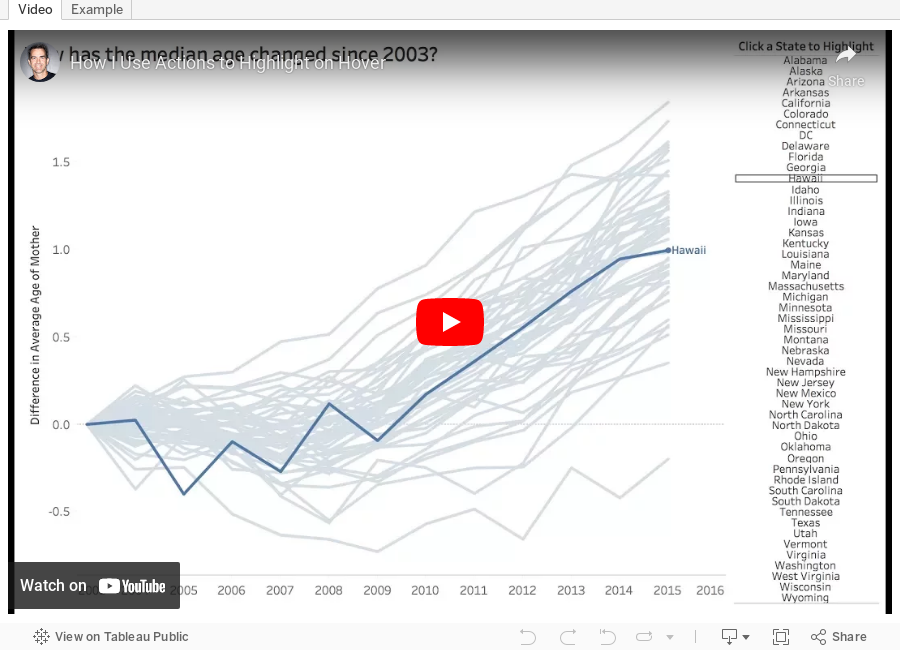
We recommended that Sarah include a highlight action so that the user can click on a State on the right and highlight the corresponding line on the bottom right. Sarah commented that she wasn't sure how to do this and Eva volunteered me (as she does) to make a video.
This week's tip will show you how to use highlight actions to hover over a State and highlight it in the line chart. I also show how to include a label on the end of the line. Enjoy!
Subscribe to:
Posts
(
Atom
)






