October 11, 2022
#MakeoverMonday 2022 Week 41 - UNDP Human Development Index
action
,
country
,
development
,
hover
,
how to
,
human
,
index
,
interactivity
,
Makeover Monday
,
select
,
table in tooltip
,
tableau
,
tips
,
tooltip
,
UNDP
,
United Nations
,
viz in tooltip
,
WatchMeViz
No comments

From UNDP:
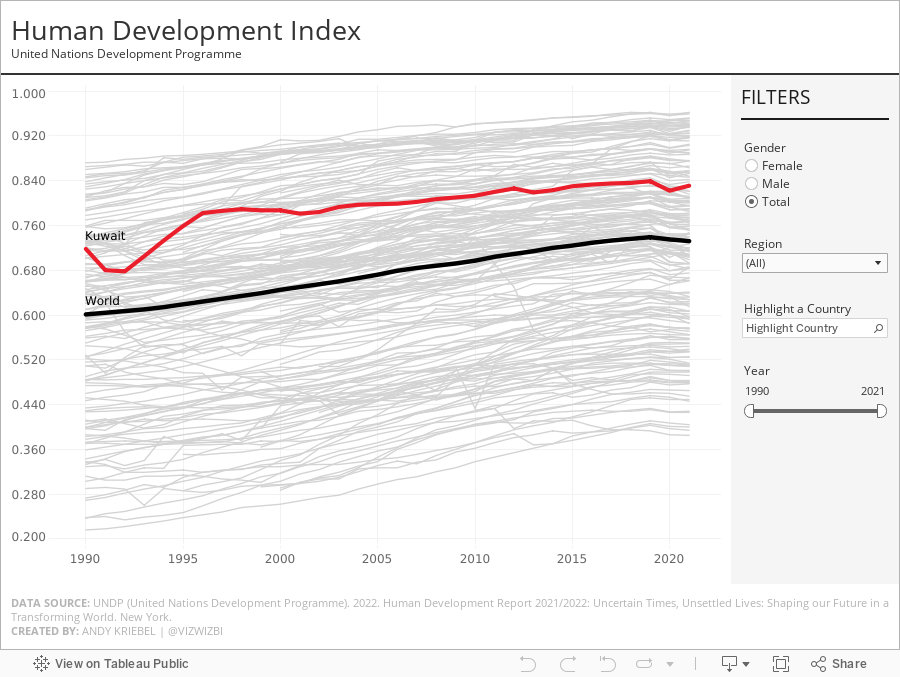
The Human Development Index (HDI) is a summary measure of average achievement in key dimensions of human development: a long and healthy life, being knowledgeable and have a decent standard of living. The HDI is the geometric mean of normalized indices for each of the three dimensions.
This week, I really liked the original visualization, so during #WatchMeViz, I spend the time recreating the visual. I got most of the way there in an hour and finished it off in the evening. The questions on the live stream are super helpful...thank you!
A couple things I learned:
- Hover action interactivity is very, very slow in Tableau. I ended up changing it to a select action.
- Labeling is overly complicated.
- Tables in a tooltip can look really good. And they are very responsive.
The final visualization is below the video. Thanks for watching!
Subscribe to:
Post Comments
(
Atom
)


No comments
Post a Comment