October 5, 2022
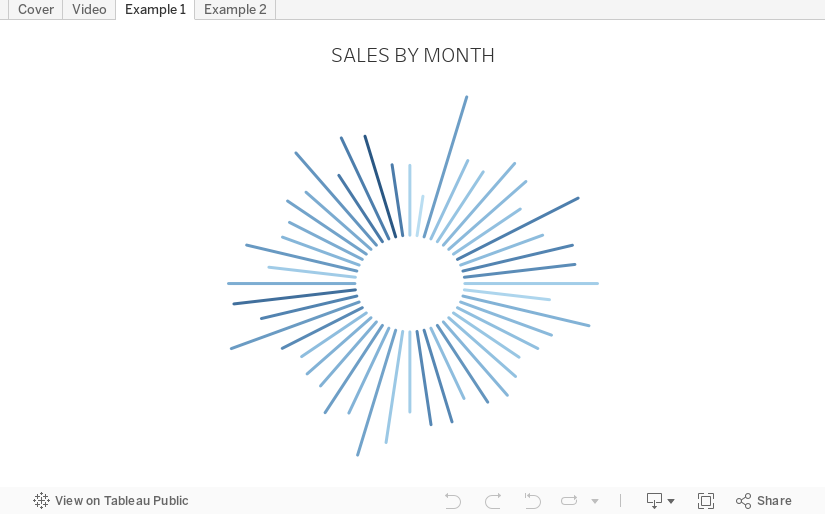
How to Create a Starburst Chart
circle timeline
,
circular timeline
,
data prep
,
date
,
how to
,
parameter
,
starburst chart
,
sunburst chart
,
tableau
,
time series
,
timeline
,
tip
,
union
1 comment
Starburst charts, sometimes called sunburst charts or circular timelines, are one method of displaying data over time. They may look cool, but they aren't exactly easy to understand. If you are going to use them, I'd advise you to check with your audience first to ensure they understand how to read them.
In this video, I take you through how to build a single starburst as well as a series of starburst charts as small multiples or trellis chart.
All of the calculations are in the description for the video here. You can download the workbook below.
Subscribe to:
Post Comments
(
Atom
)


Great post! Just wondering why my starbursts aren't in sequential order by date
ReplyDelete