Showing posts with label date range. Show all posts
July 24, 2025
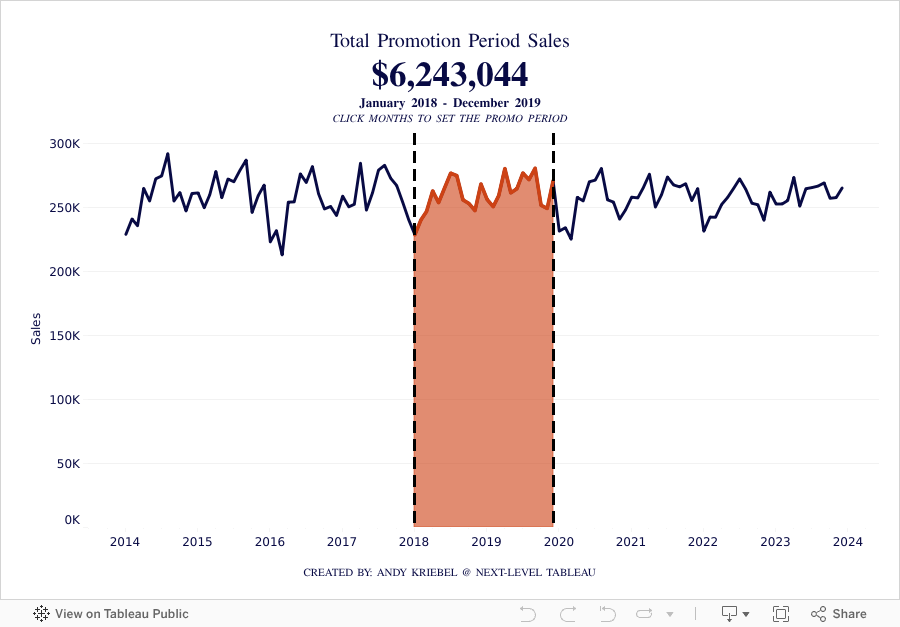
How to Add Two Values to One Parameter in Tableau
date range
,
dynamic
,
how to
,
level of detail
,
LOD
,
multiple values
,
parameter
,
parameter action
,
reference band
,
tableau
No comments

Hi! I'm Andy Kriebel.
Want to become a great Data Analyst?
Here are four ways I can help you:
1. Master Tableau & Advance Your Career: Join Next-Level Tableau, the most comprehensive program designed to take analysts from skilled to industry-leading.
→ Learn more & enroll at https://www.nextleveltableau.com/
2. Get My Tableau Core Concepts: A comprehensive, self-paced course for Tableau users ready to take their skills to the next level. Dive deeper into Tableau techniques, mastering core concepts, and create dashboards that solve real business problems
→ Grab yours https://www.nextleveltableau.com/tcc
3. Access My Tableau Starter Kit: This beginner-friendly course is your no-pressure entry point, built to help you understand the basics of Tableau — fast. You’ll learn exactly how to go from blank screen to interactive dashboard (even if you’ve never opened Tableau before).
→ Get started https://www.nextleveltableau.com/starterkit
4. The Next-Level Tableau Newsletter (FREE)
Each week, I'll send you Tableau tips, tutorials, and strategies to design better dashboards, have more impactful, and stand out in your career. Check out past issues to see if this newsletter is right for you.
January 24, 2023
How to Select a Date Range with a Set Action
calculation
,
color
,
custom dates
,
date range
,
dates
,
first
,
how to
,
last
,
level of detail
,
LOD
,
max date
,
min date
,
reference band
,
select
,
set action
,
summarize
,
tableau
,
tip
No comments

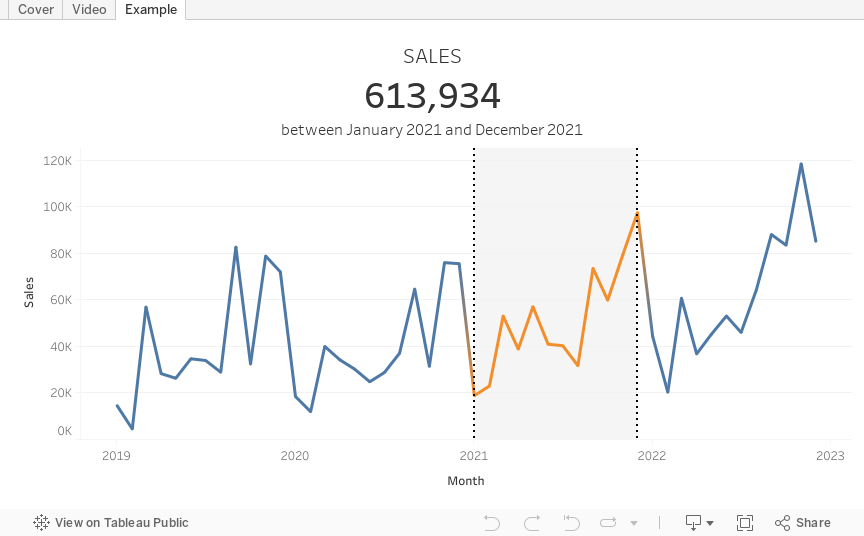
In this tip, I going to show you how to use set actions to select a date range in a line chart and summarize the values in the selected area.
In just a few steps, I’ll show you how to:
1. Create the custom date and set
2. Use the set to create a reference band
3. Color the line within the reference band
4. Calculate the totals sales within the date range
5. Configure the set action
Subscribe to:
Posts
(
Atom
)






