November 17, 2022
How to Create a 3 Level Scatterplot Drilldown
3 level drill down
,
analysis
,
color
,
count distinct
,
create set
,
dashboard action
,
data visualization
,
drill down
,
drilldown
,
how to
,
level of detail
,
LOD
,
scatterplot
,
set action
,
tableau
,
tip
No comments
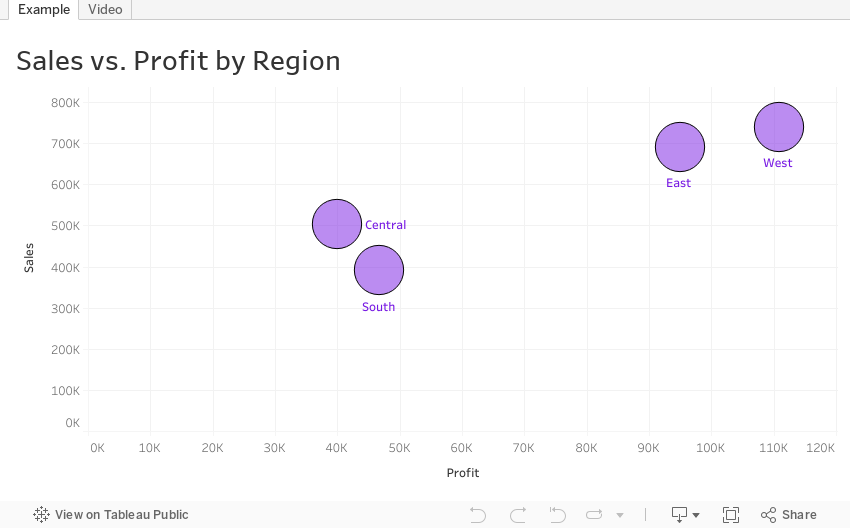
If you want to drilldown multiple levels in a scatterplot, this tip is for you. In this tip, I show you have to create a 3 level drilldown with a scatterplot.
Naturally after I showed how to create a 3 level bar chart drilldown, someone immediately asked how to do it with a scatterplot. Unlike the bar chart drilldown, the scatterplot will only show you marks for the current level.
For example:
- When I’m at the highest level, I see only regions.
- When I drill down one level, I only see States within the Region selected
- When I drill down one more level, I only see postal codes that are within the region and state I selected.
This example shows you how to drill down from Region to State to Postal Code. To use this for yourself:
- Download the workbook
- Copy all of the calculations into your workbook
- Swap out the dimensions
Note that you will need to recreate the sets and set actions. This will work with any combination of 3 dimensions.
Subscribe to:
Post Comments
(
Atom
)


No comments
Post a Comment