November 22, 2022
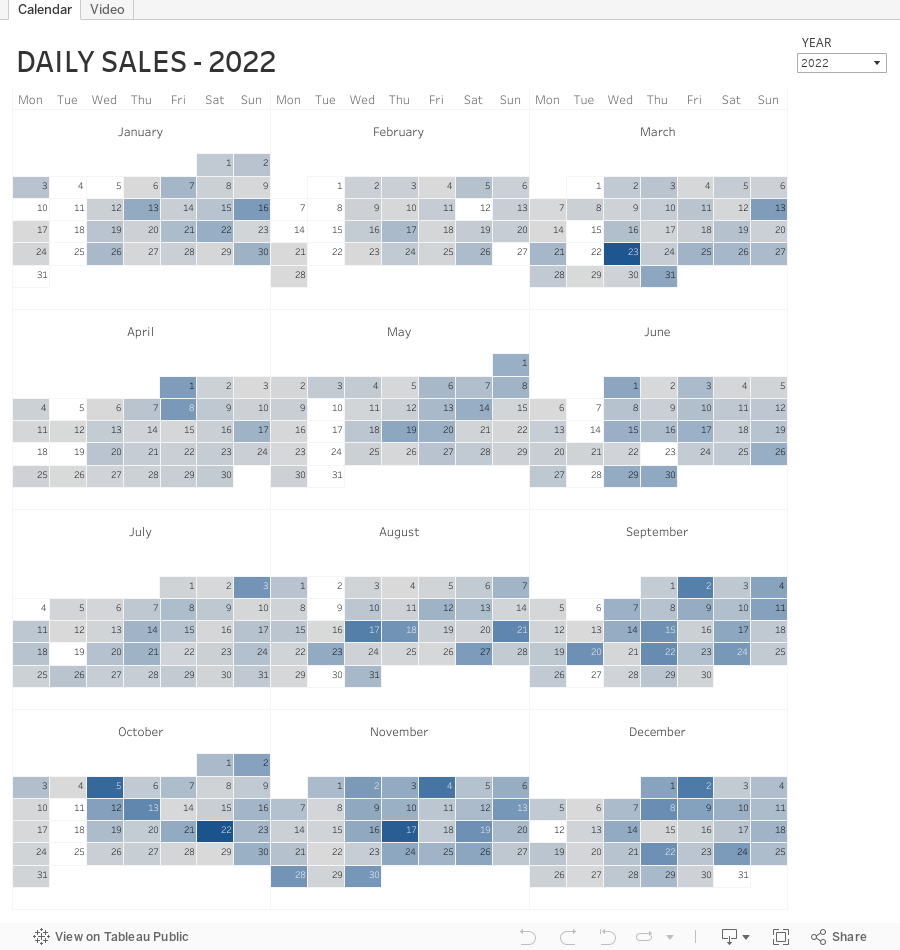
How to Create a Full Year Calendar Heatmap in Tableau
analysis
,
calculated field
,
calendar
,
custom dates
,
dual axis
,
formatting
,
group
,
heatmap
,
how to
,
label
,
LOD
,
month
,
offset
,
tableau
,
tip
,
tutorial
,
week
No comments

Calendar heatmaps are a great way to visualize time-series data over an entire calendar year. Individual days are shaded on a light-to-dark gradient based on a measure that has been added to the visualization.
Creating a heatmap for a single month in Tableau is pretty straightforward. It gets a bit more complicated when you want to view an entire year at once. In this tip, I going to show you, step-by-step, how to create a full year calendar heatmap in Tableau. The workbook is below this video to download.
Subscribe to:
Post Comments
(
Atom
)


No comments
Post a Comment