Showing posts with label offset. Show all posts
November 22, 2022
How to Create a Full Year Calendar Heatmap in Tableau
analysis
,
calculated field
,
calendar
,
custom dates
,
dual axis
,
formatting
,
group
,
heatmap
,
how to
,
label
,
LOD
,
month
,
offset
,
tableau
,
tip
,
tutorial
,
week
No comments

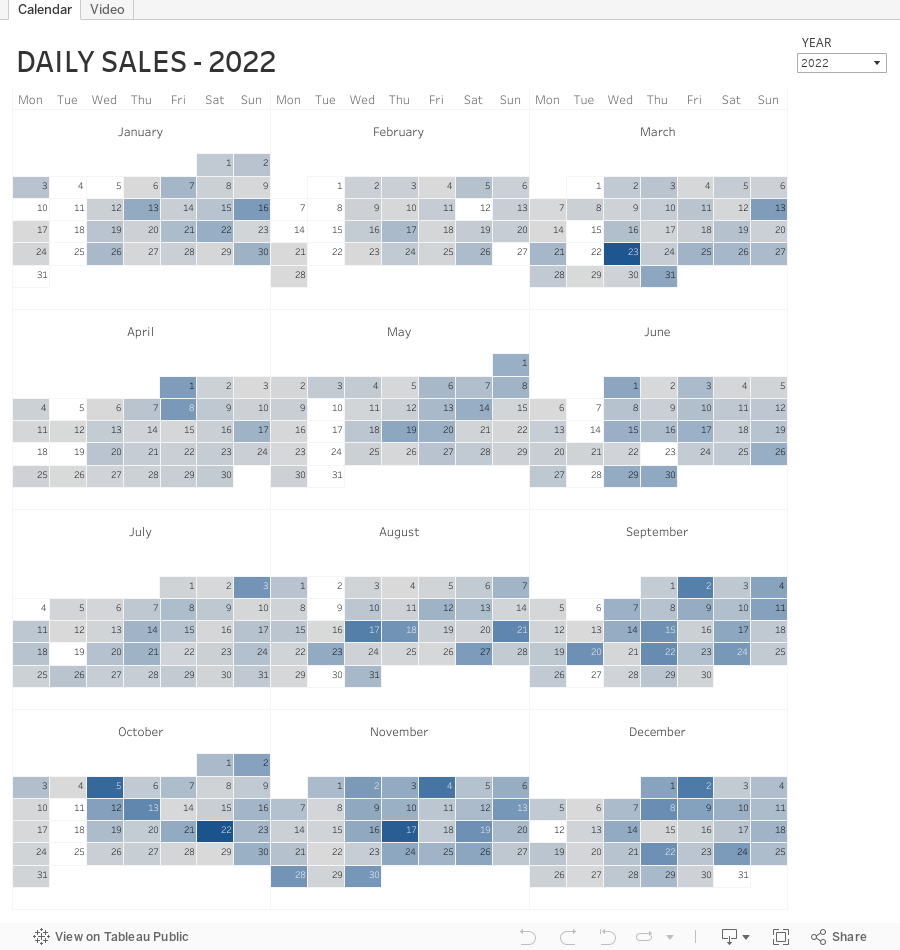
Calendar heatmaps are a great way to visualize time-series data over an entire calendar year. Individual days are shaded on a light-to-dark gradient based on a measure that has been added to the visualization.
Creating a heatmap for a single month in Tableau is pretty straightforward. It gets a bit more complicated when you want to view an entire year at once. In this tip, I going to show you, step-by-step, how to create a full year calendar heatmap in Tableau. The workbook is below this video to download.
November 20, 2018
Tableau Tip Tuesday: Using Table Calcs for Dynamic Reference Bands
buffer
,
offset
,
padding
,
parameter
,
reference band
,
reference line
,
table calc
,
Tableau Tip Tuesday
,
Workout Wednesday
No comments
For #WorkoutWednesday2018 week 46, I required people to use table calculations to:
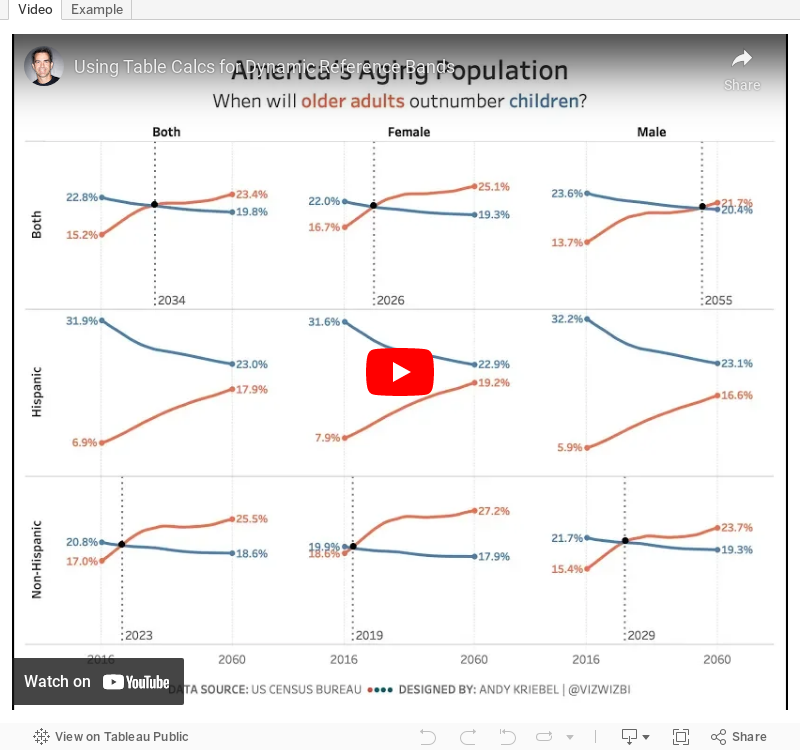

- Show the percentage of the total population for each age group for each year
- Show labels on the outside ends of the lines
- Plus some other requirements
This challenged was based on my #MakeoverMonday week 45.
In this video, I show you how to create the calculations for items 1 and 2 above. The calculations are quite simple once you know how to do them. The padding table calc is particularly useful when you will have data that updates and you can't fix the axis.
Apologies in advance for the audio cutting out every now and then.
Subscribe to:
Posts
(
Atom
)






